Immigrants from Norway vs Immigrants from Sweden Seniors Poverty Over the Age of 75
COMPARE
Immigrants from Norway
Immigrants from Sweden
Seniors Poverty Over the Age of 75
Seniors Poverty Over the Age of 75 Comparison
Immigrants from Norway
Immigrants from Sweden
12.1%
SENIORS POVERTY OVER THE AGE OF 75
60.6/ 100
METRIC RATING
161st/ 347
METRIC RANK
11.6%
SENIORS POVERTY OVER THE AGE OF 75
92.6/ 100
METRIC RATING
96th/ 347
METRIC RANK
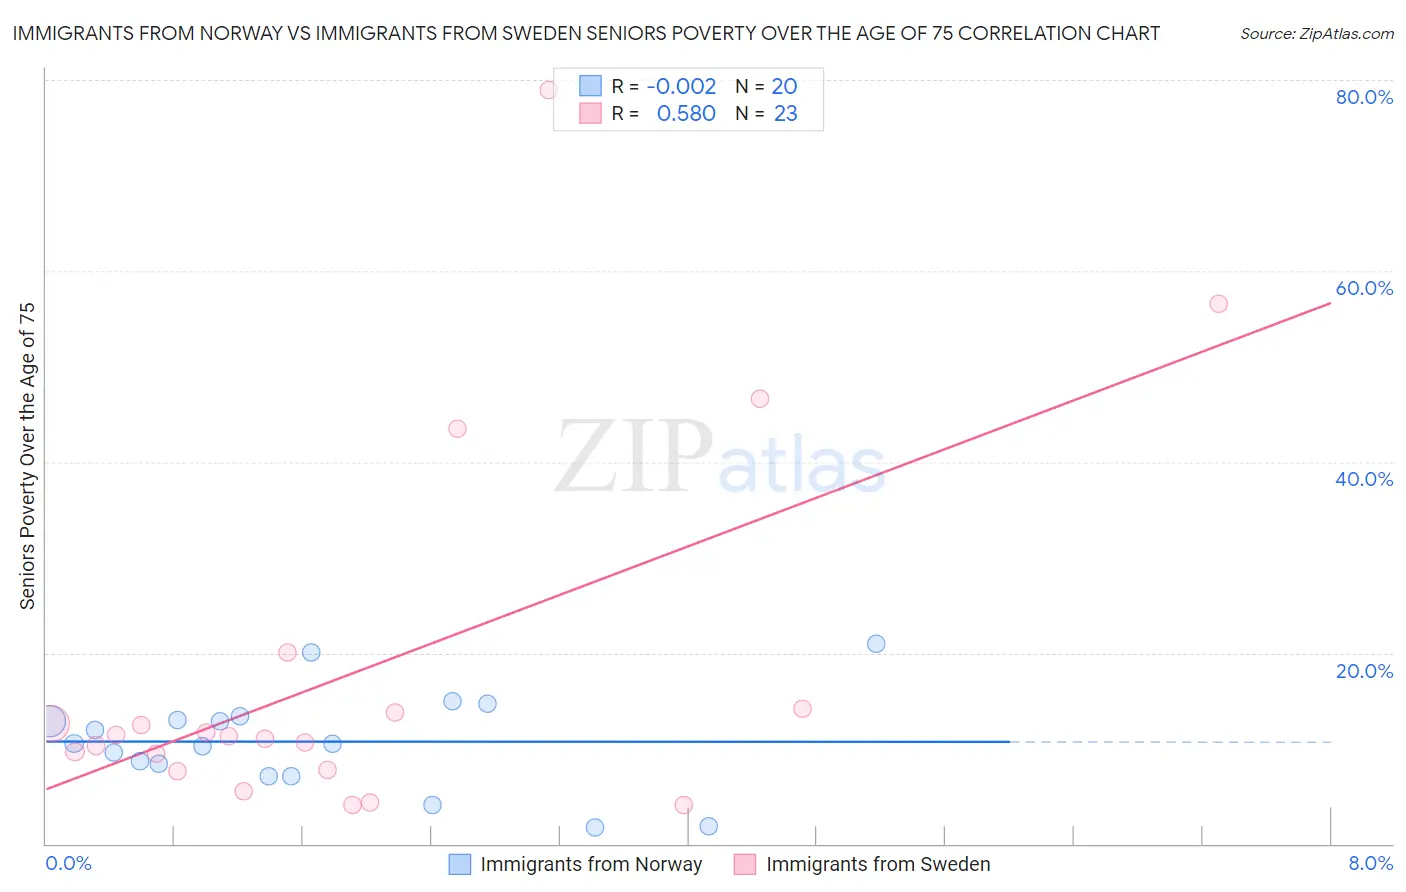
Immigrants from Norway vs Immigrants from Sweden Seniors Poverty Over the Age of 75 Correlation Chart
The statistical analysis conducted on geographies consisting of 116,318,063 people shows no correlation between the proportion of Immigrants from Norway and poverty level among seniors over the age of 75 in the United States with a correlation coefficient (R) of -0.002 and weighted average of 12.1%. Similarly, the statistical analysis conducted on geographies consisting of 163,927,816 people shows a substantial positive correlation between the proportion of Immigrants from Sweden and poverty level among seniors over the age of 75 in the United States with a correlation coefficient (R) of 0.580 and weighted average of 11.6%, a difference of 4.5%.
Seniors Poverty Over the Age of 75 Correlation Summary
| Measurement | Immigrants from Norway | Immigrants from Sweden |
| Minimum | 1.8% | 4.0% |
| Maximum | 21.0% | 78.9% |
| Range | 19.2% | 74.9% |
| Mean | 10.7% | 18.1% |
| Median | 10.4% | 11.3% |
| Interquartile 25% (IQ1) | 7.8% | 7.7% |
| Interquartile 75% (IQ3) | 13.1% | 14.1% |
| Interquartile Range (IQR) | 5.3% | 6.3% |
| Standard Deviation (Sample) | 5.1% | 19.2% |
| Standard Deviation (Population) | 4.9% | 18.8% |
Similar Demographics by Seniors Poverty Over the Age of 75
Demographics Similar to Immigrants from Norway by Seniors Poverty Over the Age of 75
In terms of seniors poverty over the age of 75, the demographic groups most similar to Immigrants from Norway are Immigrants from Eastern Africa (12.1%, a difference of 0.020%), Immigrants from Serbia (12.1%, a difference of 0.030%), Immigrants from Middle Africa (12.1%, a difference of 0.050%), Portuguese (12.1%, a difference of 0.060%), and Immigrants from Sudan (12.1%, a difference of 0.090%).
| Demographics | Rating | Rank | Seniors Poverty Over the Age of 75 |
| Cambodians | 64.0 /100 | #154 | Good 12.0% |
| Indonesians | 62.6 /100 | #155 | Good 12.1% |
| Immigrants | Burma/Myanmar | 62.3 /100 | #156 | Good 12.1% |
| Immigrants | Sudan | 61.7 /100 | #157 | Good 12.1% |
| Portuguese | 61.3 /100 | #158 | Good 12.1% |
| Immigrants | Middle Africa | 61.2 /100 | #159 | Good 12.1% |
| Immigrants | Eastern Africa | 60.9 /100 | #160 | Good 12.1% |
| Immigrants | Norway | 60.6 /100 | #161 | Good 12.1% |
| Immigrants | Serbia | 60.2 /100 | #162 | Good 12.1% |
| Immigrants | Greece | 58.2 /100 | #163 | Average 12.1% |
| Potawatomi | 57.4 /100 | #164 | Average 12.1% |
| Okinawans | 56.3 /100 | #165 | Average 12.1% |
| Egyptians | 54.8 /100 | #166 | Average 12.1% |
| Immigrants | Switzerland | 54.5 /100 | #167 | Average 12.1% |
| Immigrants | Syria | 53.9 /100 | #168 | Average 12.2% |
Demographics Similar to Immigrants from Sweden by Seniors Poverty Over the Age of 75
In terms of seniors poverty over the age of 75, the demographic groups most similar to Immigrants from Sweden are Immigrants from Bosnia and Herzegovina (11.6%, a difference of 0.0%), Creek (11.6%, a difference of 0.040%), Romanian (11.6%, a difference of 0.080%), Immigrants from Poland (11.6%, a difference of 0.090%), and Immigrants from Japan (11.6%, a difference of 0.20%).
| Demographics | Rating | Rank | Seniors Poverty Over the Age of 75 |
| Immigrants | Sri Lanka | 94.4 /100 | #89 | Exceptional 11.5% |
| Aleuts | 94.1 /100 | #90 | Exceptional 11.5% |
| Immigrants | Germany | 94.1 /100 | #91 | Exceptional 11.5% |
| Kenyans | 93.9 /100 | #92 | Exceptional 11.5% |
| Immigrants | Poland | 92.9 /100 | #93 | Exceptional 11.6% |
| Creek | 92.7 /100 | #94 | Exceptional 11.6% |
| Immigrants | Bosnia and Herzegovina | 92.6 /100 | #95 | Exceptional 11.6% |
| Immigrants | Sweden | 92.6 /100 | #96 | Exceptional 11.6% |
| Romanians | 92.3 /100 | #97 | Exceptional 11.6% |
| Immigrants | Japan | 91.9 /100 | #98 | Exceptional 11.6% |
| Immigrants | Ethiopia | 91.7 /100 | #99 | Exceptional 11.6% |
| Syrians | 91.1 /100 | #100 | Exceptional 11.6% |
| Jordanians | 90.8 /100 | #101 | Exceptional 11.6% |
| Guamanians/Chamorros | 90.6 /100 | #102 | Exceptional 11.6% |
| Immigrants | Kuwait | 90.5 /100 | #103 | Exceptional 11.6% |