Immigrants from Northern Europe vs Tlingit-Haida Single Father Poverty
COMPARE
Immigrants from Northern Europe
Tlingit-Haida
Single Father Poverty
Single Father Poverty Comparison
Immigrants from Northern Europe
Tlingit-Haida
16.5%
SINGLE FATHER POVERTY
20.3/ 100
METRIC RATING
197th/ 347
METRIC RANK
15.3%
SINGLE FATHER POVERTY
99.5/ 100
METRIC RATING
78th/ 347
METRIC RANK
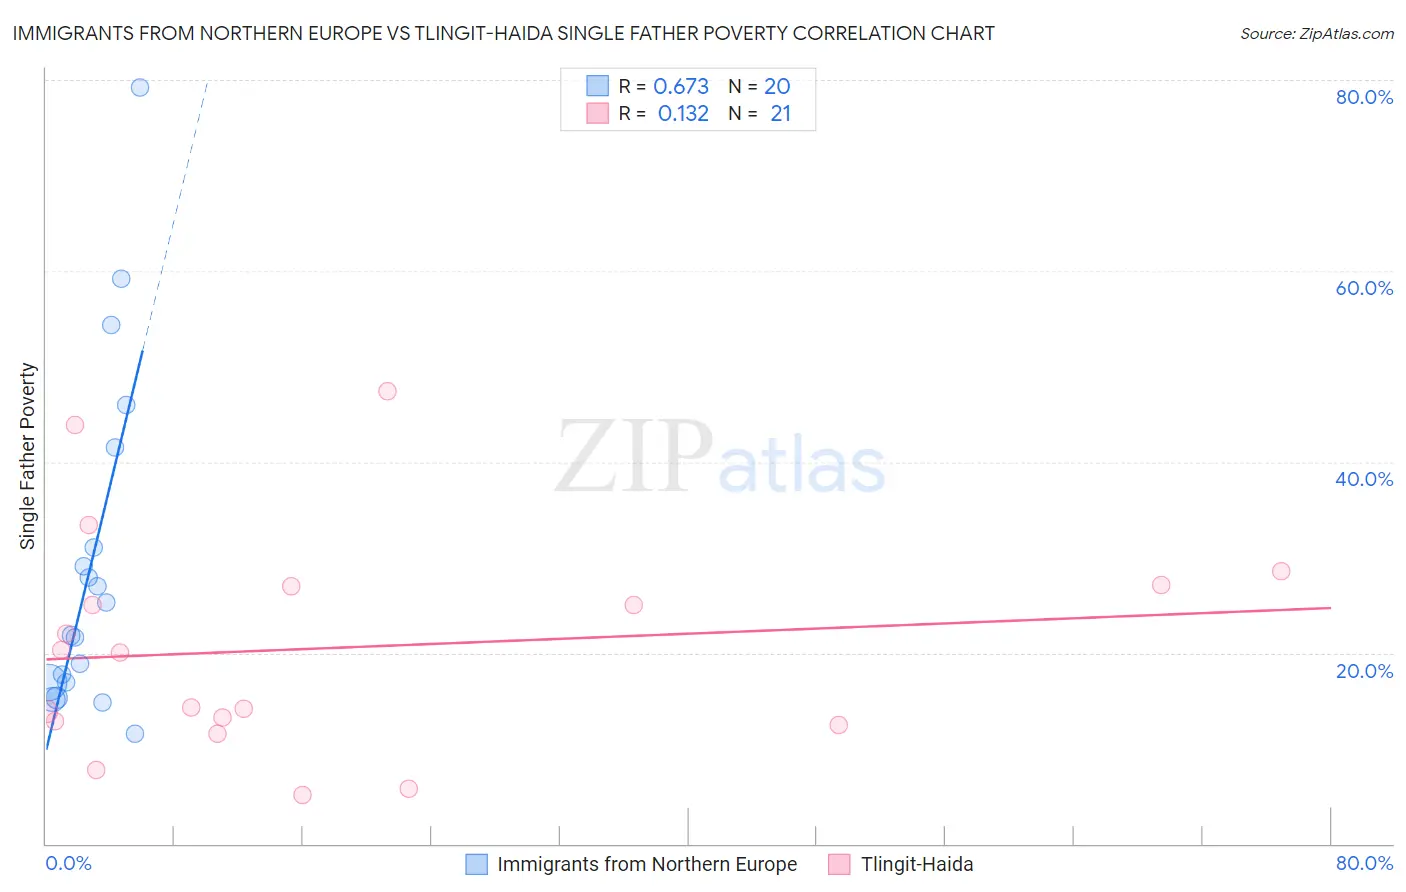
Immigrants from Northern Europe vs Tlingit-Haida Single Father Poverty Correlation Chart
The statistical analysis conducted on geographies consisting of 359,106,095 people shows a significant positive correlation between the proportion of Immigrants from Northern Europe and poverty level among single fathers in the United States with a correlation coefficient (R) of 0.673 and weighted average of 16.5%. Similarly, the statistical analysis conducted on geographies consisting of 55,978,156 people shows a poor positive correlation between the proportion of Tlingit-Haida and poverty level among single fathers in the United States with a correlation coefficient (R) of 0.132 and weighted average of 15.3%, a difference of 7.8%.
Single Father Poverty Correlation Summary
| Measurement | Immigrants from Northern Europe | Tlingit-Haida |
| Minimum | 11.5% | 5.1% |
| Maximum | 79.2% | 47.4% |
| Range | 67.7% | 42.2% |
| Mean | 29.5% | 20.5% |
| Median | 23.6% | 20.0% |
| Interquartile 25% (IQ1) | 16.9% | 12.6% |
| Interquartile 75% (IQ3) | 36.3% | 27.1% |
| Interquartile Range (IQR) | 19.4% | 14.4% |
| Standard Deviation (Sample) | 17.8% | 11.5% |
| Standard Deviation (Population) | 17.4% | 11.2% |
Similar Demographics by Single Father Poverty
Demographics Similar to Immigrants from Northern Europe by Single Father Poverty
In terms of single father poverty, the demographic groups most similar to Immigrants from Northern Europe are Romanian (16.5%, a difference of 0.010%), Immigrants from Belize (16.5%, a difference of 0.030%), Immigrants from Canada (16.5%, a difference of 0.11%), Syrian (16.6%, a difference of 0.20%), and Cape Verdean (16.5%, a difference of 0.26%).
| Demographics | Rating | Rank | Single Father Poverty |
| Immigrants | Burma/Myanmar | 28.0 /100 | #190 | Fair 16.5% |
| Immigrants | Guyana | 27.1 /100 | #191 | Fair 16.5% |
| Immigrants | Switzerland | 24.8 /100 | #192 | Fair 16.5% |
| Ecuadorians | 24.5 /100 | #193 | Fair 16.5% |
| Cape Verdeans | 24.4 /100 | #194 | Fair 16.5% |
| Immigrants | Barbados | 24.3 /100 | #195 | Fair 16.5% |
| Immigrants | Canada | 21.9 /100 | #196 | Fair 16.5% |
| Immigrants | Northern Europe | 20.3 /100 | #197 | Fair 16.5% |
| Romanians | 20.1 /100 | #198 | Fair 16.5% |
| Immigrants | Belize | 19.8 /100 | #199 | Poor 16.5% |
| Syrians | 17.4 /100 | #200 | Poor 16.6% |
| Cubans | 16.5 /100 | #201 | Poor 16.6% |
| Immigrants | Croatia | 16.5 /100 | #202 | Poor 16.6% |
| Immigrants | North America | 15.1 /100 | #203 | Poor 16.6% |
| Immigrants | Guatemala | 14.8 /100 | #204 | Poor 16.6% |
Demographics Similar to Tlingit-Haida by Single Father Poverty
In terms of single father poverty, the demographic groups most similar to Tlingit-Haida are Immigrants from Northern Africa (15.3%, a difference of 0.020%), Immigrants from Peru (15.3%, a difference of 0.050%), Immigrants from Japan (15.3%, a difference of 0.060%), Immigrants from Turkey (15.3%, a difference of 0.14%), and Maltese (15.3%, a difference of 0.16%).
| Demographics | Rating | Rank | Single Father Poverty |
| Immigrants | Brazil | 99.6 /100 | #71 | Exceptional 15.3% |
| Immigrants | Lithuania | 99.6 /100 | #72 | Exceptional 15.3% |
| Kenyans | 99.6 /100 | #73 | Exceptional 15.3% |
| Maltese | 99.6 /100 | #74 | Exceptional 15.3% |
| Immigrants | Turkey | 99.5 /100 | #75 | Exceptional 15.3% |
| Immigrants | Japan | 99.5 /100 | #76 | Exceptional 15.3% |
| Immigrants | Peru | 99.5 /100 | #77 | Exceptional 15.3% |
| Tlingit-Haida | 99.5 /100 | #78 | Exceptional 15.3% |
| Immigrants | Northern Africa | 99.5 /100 | #79 | Exceptional 15.3% |
| Armenians | 99.4 /100 | #80 | Exceptional 15.4% |
| Immigrants | Congo | 99.4 /100 | #81 | Exceptional 15.4% |
| Immigrants | Ukraine | 99.4 /100 | #82 | Exceptional 15.4% |
| Chinese | 99.3 /100 | #83 | Exceptional 15.4% |
| Peruvians | 99.2 /100 | #84 | Exceptional 15.4% |
| Immigrants | Oceania | 99.1 /100 | #85 | Exceptional 15.4% |