Immigrants from Northern Africa vs Slovak Child Poverty Under the Age of 16
COMPARE
Immigrants from Northern Africa
Slovak
Child Poverty Under the Age of 16
Child Poverty Under the Age of 16 Comparison
Immigrants from Northern Africa
Slovaks
15.8%
CHILD POVERTY UNDER THE AGE OF 16
68.1/ 100
METRIC RATING
161st/ 347
METRIC RANK
15.5%
CHILD POVERTY UNDER THE AGE OF 16
81.4/ 100
METRIC RATING
146th/ 347
METRIC RANK
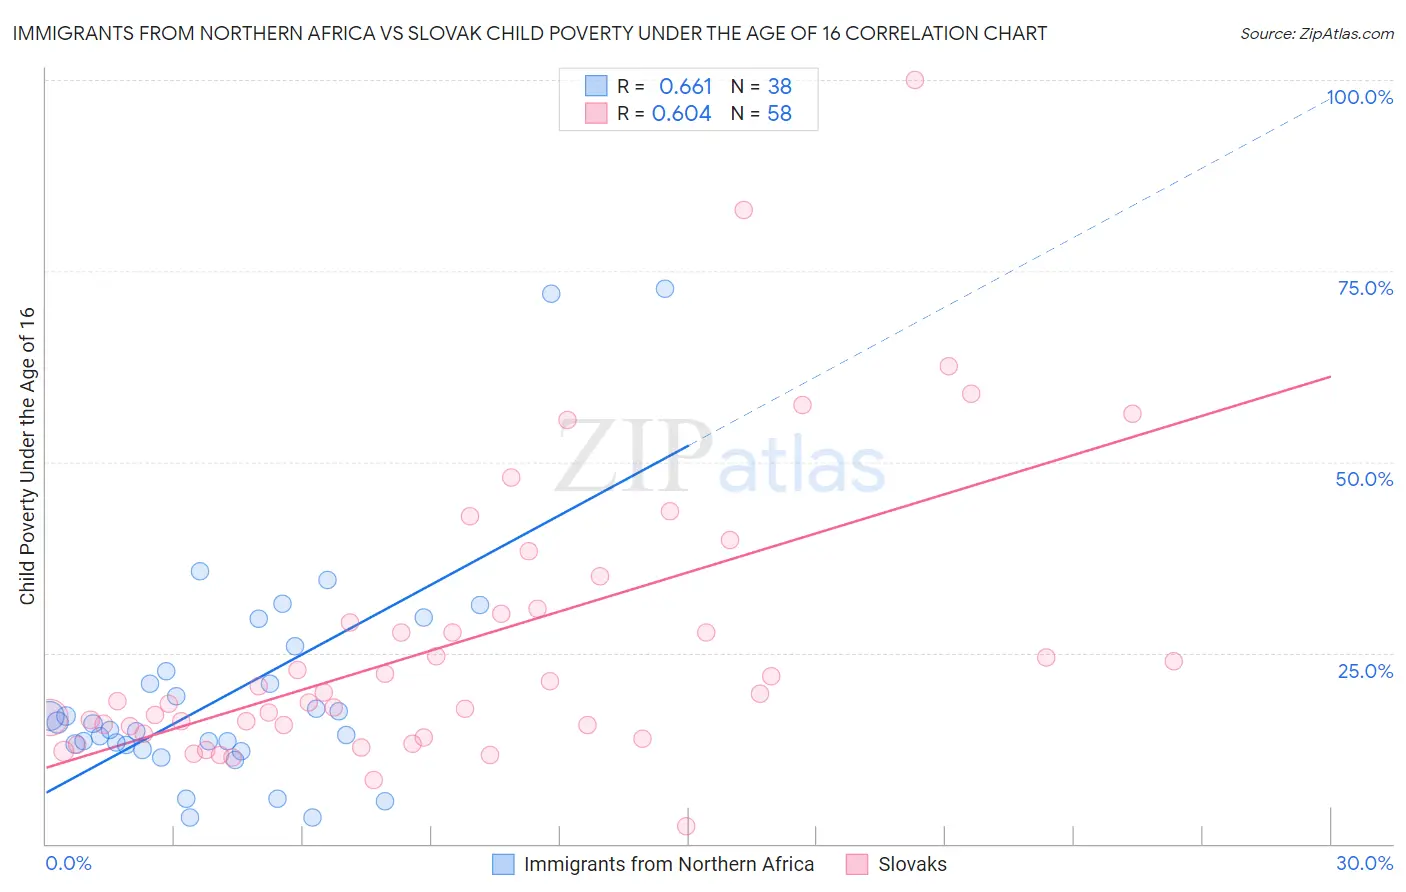
Immigrants from Northern Africa vs Slovak Child Poverty Under the Age of 16 Correlation Chart
The statistical analysis conducted on geographies consisting of 319,048,097 people shows a significant positive correlation between the proportion of Immigrants from Northern Africa and poverty level among children under the age of 16 in the United States with a correlation coefficient (R) of 0.661 and weighted average of 15.8%. Similarly, the statistical analysis conducted on geographies consisting of 392,498,912 people shows a significant positive correlation between the proportion of Slovaks and poverty level among children under the age of 16 in the United States with a correlation coefficient (R) of 0.604 and weighted average of 15.5%, a difference of 2.3%.
Child Poverty Under the Age of 16 Correlation Summary
| Measurement | Immigrants from Northern Africa | Slovak |
| Minimum | 3.4% | 2.2% |
| Maximum | 72.6% | 100.0% |
| Range | 69.3% | 97.8% |
| Mean | 19.9% | 26.4% |
| Median | 15.3% | 19.2% |
| Interquartile 25% (IQ1) | 13.0% | 15.4% |
| Interquartile 75% (IQ3) | 22.6% | 30.2% |
| Interquartile Range (IQR) | 9.7% | 14.8% |
| Standard Deviation (Sample) | 15.0% | 18.7% |
| Standard Deviation (Population) | 14.8% | 18.5% |
Demographics Similar to Immigrants from Northern Africa and Slovaks by Child Poverty Under the Age of 16
In terms of child poverty under the age of 16, the demographic groups most similar to Immigrants from Northern Africa are Colombian (15.8%, a difference of 0.060%), Yugoslavian (15.8%, a difference of 0.060%), Immigrants from Albania (15.8%, a difference of 0.38%), Immigrants from Fiji (15.8%, a difference of 0.45%), and Immigrants from Chile (15.7%, a difference of 0.71%). Similarly, the demographic groups most similar to Slovaks are Immigrants from Peru (15.5%, a difference of 0.040%), Immigrants from Hungary (15.5%, a difference of 0.10%), Immigrants from Kuwait (15.5%, a difference of 0.19%), Icelander (15.4%, a difference of 0.21%), and Puget Sound Salish (15.5%, a difference of 0.23%).
| Demographics | Rating | Rank | Child Poverty Under the Age of 16 |
| Icelanders | 82.5 /100 | #143 | Excellent 15.4% |
| Immigrants | Hungary | 81.9 /100 | #144 | Excellent 15.5% |
| Immigrants | Peru | 81.7 /100 | #145 | Excellent 15.5% |
| Slovaks | 81.4 /100 | #146 | Excellent 15.5% |
| Immigrants | Kuwait | 80.5 /100 | #147 | Excellent 15.5% |
| Puget Sound Salish | 80.3 /100 | #148 | Excellent 15.5% |
| Israelis | 80.1 /100 | #149 | Excellent 15.5% |
| Immigrants | Jordan | 78.5 /100 | #150 | Good 15.6% |
| French | 78.5 /100 | #151 | Good 15.6% |
| French Canadians | 78.2 /100 | #152 | Good 15.6% |
| Venezuelans | 77.4 /100 | #153 | Good 15.6% |
| Samoans | 77.3 /100 | #154 | Good 15.6% |
| Syrians | 76.1 /100 | #155 | Good 15.6% |
| Immigrants | Venezuela | 74.9 /100 | #156 | Good 15.7% |
| Immigrants | Nepal | 72.9 /100 | #157 | Good 15.7% |
| Immigrants | Chile | 72.8 /100 | #158 | Good 15.7% |
| Immigrants | Fiji | 71.1 /100 | #159 | Good 15.8% |
| Immigrants | Albania | 70.7 /100 | #160 | Good 15.8% |
| Immigrants | Northern Africa | 68.1 /100 | #161 | Good 15.8% |
| Colombians | 67.6 /100 | #162 | Good 15.8% |
| Yugoslavians | 67.6 /100 | #163 | Good 15.8% |