Immigrants from Northern Africa vs Immigrants from Eastern Europe Seniors Poverty Over the Age of 75
COMPARE
Immigrants from Northern Africa
Immigrants from Eastern Europe
Seniors Poverty Over the Age of 75
Seniors Poverty Over the Age of 75 Comparison
Immigrants from Northern Africa
Immigrants from Eastern Europe
12.5%
SENIORS POVERTY OVER THE AGE OF 75
25.2/ 100
METRIC RATING
188th/ 347
METRIC RANK
12.6%
SENIORS POVERTY OVER THE AGE OF 75
16.0/ 100
METRIC RATING
196th/ 347
METRIC RANK
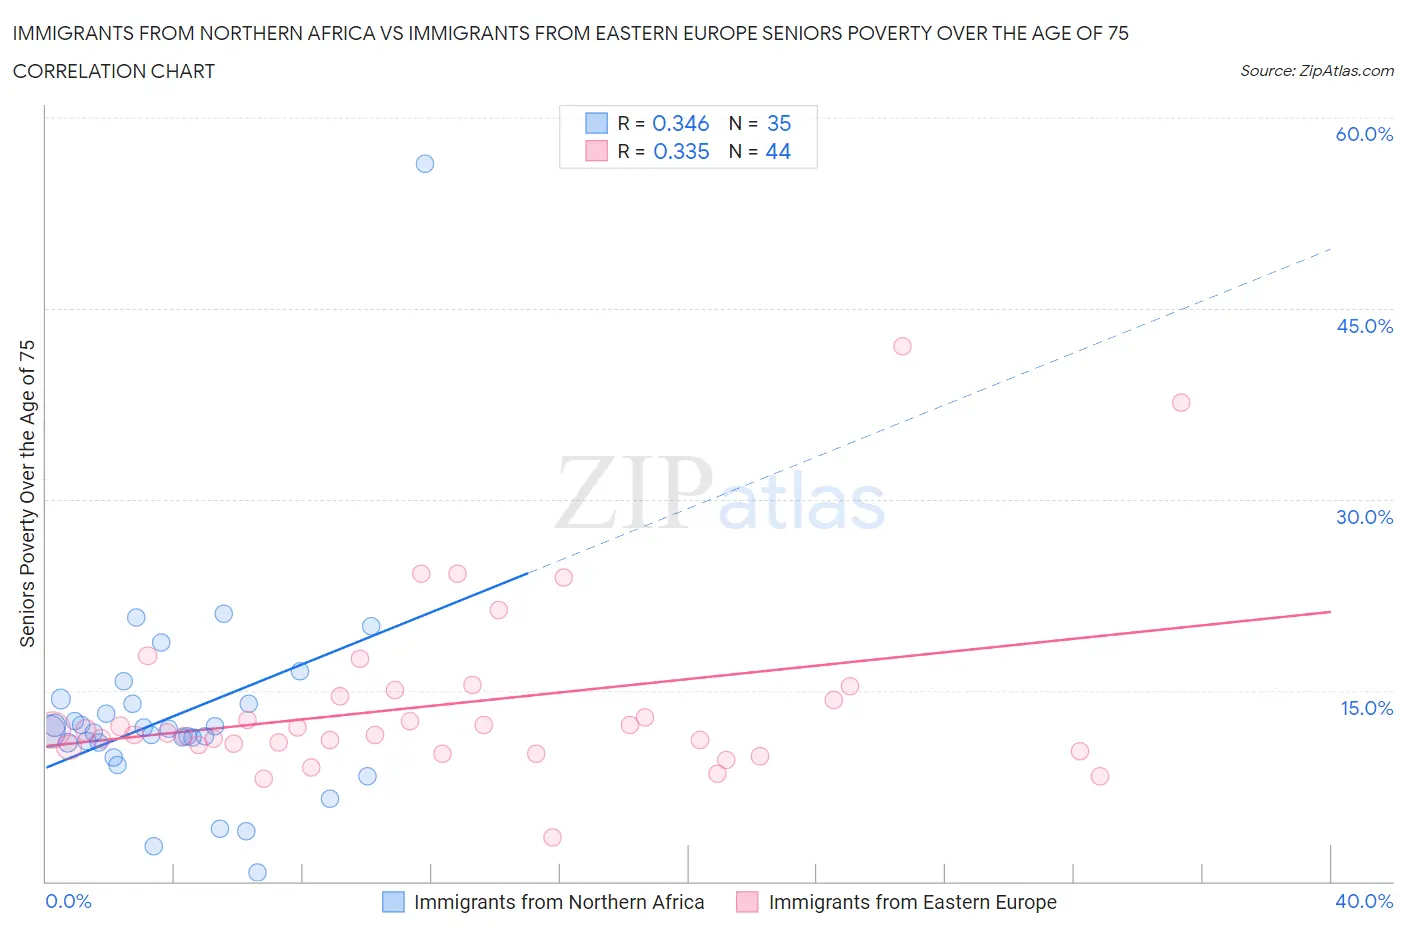
Immigrants from Northern Africa vs Immigrants from Eastern Europe Seniors Poverty Over the Age of 75 Correlation Chart
The statistical analysis conducted on geographies consisting of 318,437,817 people shows a mild positive correlation between the proportion of Immigrants from Northern Africa and poverty level among seniors over the age of 75 in the United States with a correlation coefficient (R) of 0.346 and weighted average of 12.5%. Similarly, the statistical analysis conducted on geographies consisting of 467,331,078 people shows a mild positive correlation between the proportion of Immigrants from Eastern Europe and poverty level among seniors over the age of 75 in the United States with a correlation coefficient (R) of 0.335 and weighted average of 12.6%, a difference of 1.1%.
Seniors Poverty Over the Age of 75 Correlation Summary
| Measurement | Immigrants from Northern Africa | Immigrants from Eastern Europe |
| Minimum | 0.66% | 3.4% |
| Maximum | 56.4% | 42.0% |
| Range | 55.7% | 38.6% |
| Mean | 13.0% | 13.9% |
| Median | 11.8% | 11.8% |
| Interquartile 25% (IQ1) | 10.9% | 10.6% |
| Interquartile 75% (IQ3) | 14.0% | 14.8% |
| Interquartile Range (IQR) | 3.1% | 4.2% |
| Standard Deviation (Sample) | 8.8% | 7.1% |
| Standard Deviation (Population) | 8.7% | 7.0% |
Demographics Similar to Immigrants from Northern Africa and Immigrants from Eastern Europe by Seniors Poverty Over the Age of 75
In terms of seniors poverty over the age of 75, the demographic groups most similar to Immigrants from Northern Africa are Yaqui (12.5%, a difference of 0.070%), Immigrants from Indonesia (12.5%, a difference of 0.090%), Immigrants from Congo (12.5%, a difference of 0.15%), Liberian (12.5%, a difference of 0.22%), and Choctaw (12.5%, a difference of 0.57%). Similarly, the demographic groups most similar to Immigrants from Eastern Europe are Immigrants from France (12.6%, a difference of 0.19%), Alsatian (12.6%, a difference of 0.23%), Taiwanese (12.6%, a difference of 0.24%), Nepalese (12.6%, a difference of 0.26%), and Chilean (12.6%, a difference of 0.37%).
| Demographics | Rating | Rank | Seniors Poverty Over the Age of 75 |
| German Russians | 41.4 /100 | #182 | Average 12.3% |
| Laotians | 38.2 /100 | #183 | Fair 12.3% |
| Kiowa | 36.0 /100 | #184 | Fair 12.3% |
| Immigrants | Malaysia | 35.8 /100 | #185 | Fair 12.3% |
| Sri Lankans | 32.3 /100 | #186 | Fair 12.4% |
| Yaqui | 25.9 /100 | #187 | Fair 12.5% |
| Immigrants | Northern Africa | 25.2 /100 | #188 | Fair 12.5% |
| Immigrants | Indonesia | 24.4 /100 | #189 | Fair 12.5% |
| Immigrants | Congo | 23.9 /100 | #190 | Fair 12.5% |
| Liberians | 23.2 /100 | #191 | Fair 12.5% |
| Choctaw | 20.2 /100 | #192 | Fair 12.5% |
| Taiwanese | 17.8 /100 | #193 | Poor 12.6% |
| Alsatians | 17.7 /100 | #194 | Poor 12.6% |
| Immigrants | France | 17.4 /100 | #195 | Poor 12.6% |
| Immigrants | Eastern Europe | 16.0 /100 | #196 | Poor 12.6% |
| Nepalese | 14.4 /100 | #197 | Poor 12.6% |
| Chileans | 13.7 /100 | #198 | Poor 12.6% |
| Immigrants | Lebanon | 12.7 /100 | #199 | Poor 12.7% |
| Immigrants | Vietnam | 12.1 /100 | #200 | Poor 12.7% |
| Paraguayans | 11.1 /100 | #201 | Poor 12.7% |
| Arapaho | 10.9 /100 | #202 | Poor 12.7% |