Immigrants from North Macedonia vs Jamaican Seniors Poverty Over the Age of 75
COMPARE
Immigrants from North Macedonia
Jamaican
Seniors Poverty Over the Age of 75
Seniors Poverty Over the Age of 75 Comparison
Immigrants from North Macedonia
Jamaicans
11.1%
SENIORS POVERTY OVER THE AGE OF 75
98.6/ 100
METRIC RATING
51st/ 347
METRIC RANK
15.1%
SENIORS POVERTY OVER THE AGE OF 75
0.0/ 100
METRIC RATING
288th/ 347
METRIC RANK
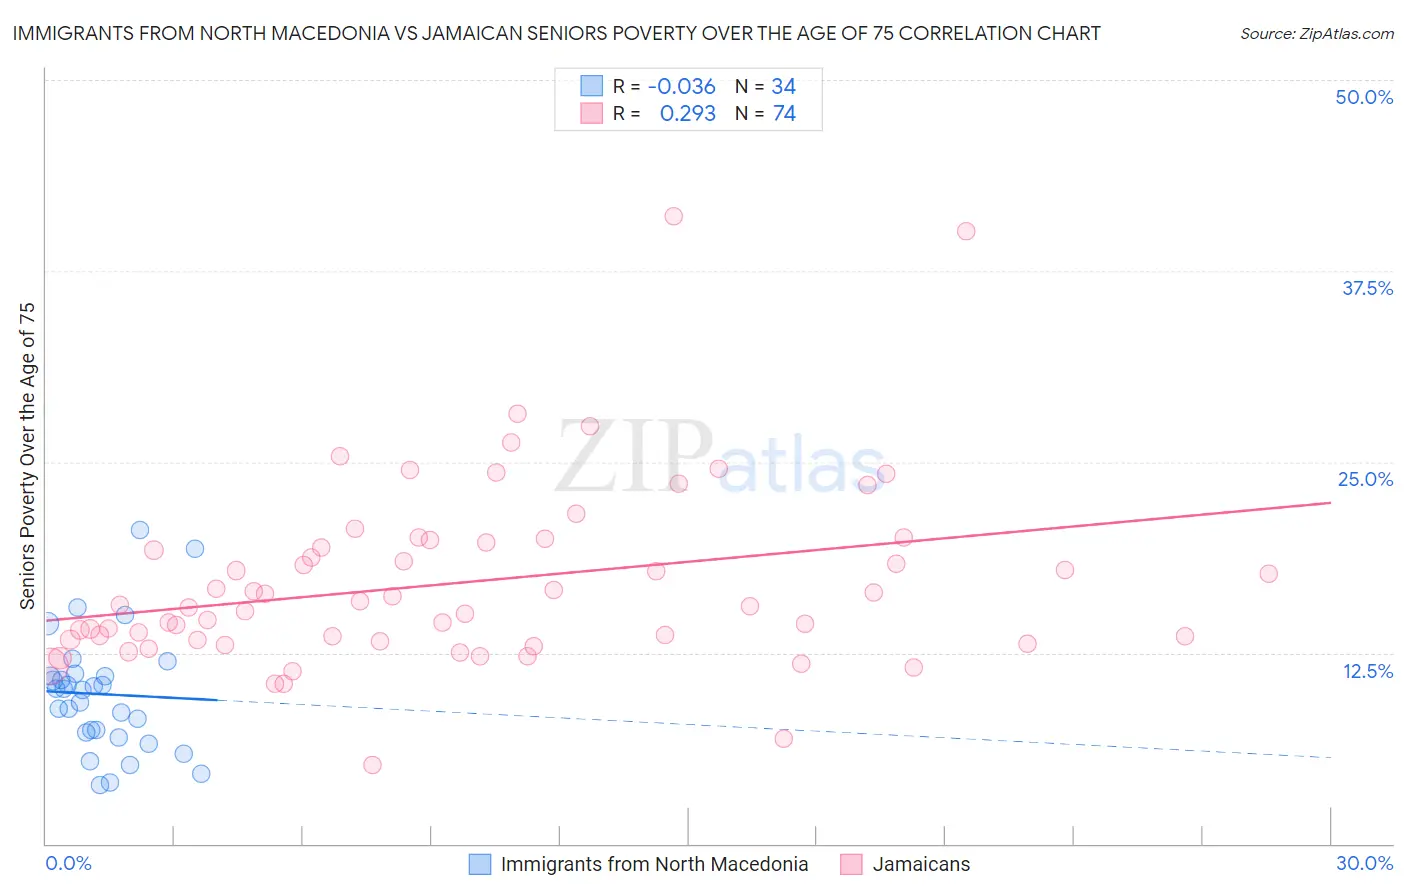
Immigrants from North Macedonia vs Jamaican Seniors Poverty Over the Age of 75 Correlation Chart
The statistical analysis conducted on geographies consisting of 74,053,541 people shows no correlation between the proportion of Immigrants from North Macedonia and poverty level among seniors over the age of 75 in the United States with a correlation coefficient (R) of -0.036 and weighted average of 11.1%. Similarly, the statistical analysis conducted on geographies consisting of 363,692,137 people shows a weak positive correlation between the proportion of Jamaicans and poverty level among seniors over the age of 75 in the United States with a correlation coefficient (R) of 0.293 and weighted average of 15.1%, a difference of 36.0%.
Seniors Poverty Over the Age of 75 Correlation Summary
| Measurement | Immigrants from North Macedonia | Jamaican |
| Minimum | 3.8% | 5.1% |
| Maximum | 20.6% | 41.1% |
| Range | 16.7% | 35.9% |
| Mean | 9.8% | 17.1% |
| Median | 10.1% | 15.6% |
| Interquartile 25% (IQ1) | 7.3% | 13.4% |
| Interquartile 75% (IQ3) | 11.0% | 19.7% |
| Interquartile Range (IQR) | 3.7% | 6.3% |
| Standard Deviation (Sample) | 3.9% | 6.1% |
| Standard Deviation (Population) | 3.8% | 6.0% |
Similar Demographics by Seniors Poverty Over the Age of 75
Demographics Similar to Immigrants from North Macedonia by Seniors Poverty Over the Age of 75
In terms of seniors poverty over the age of 75, the demographic groups most similar to Immigrants from North Macedonia are Serbian (11.1%, a difference of 0.030%), Samoan (11.1%, a difference of 0.14%), Zimbabwean (11.2%, a difference of 0.16%), Immigrants from England (11.2%, a difference of 0.22%), and French (11.1%, a difference of 0.25%).
| Demographics | Rating | Rank | Seniors Poverty Over the Age of 75 |
| Belgians | 99.1 /100 | #44 | Exceptional 11.0% |
| Carpatho Rusyns | 99.0 /100 | #45 | Exceptional 11.1% |
| Greeks | 99.0 /100 | #46 | Exceptional 11.1% |
| Hawaiians | 98.8 /100 | #47 | Exceptional 11.1% |
| French | 98.7 /100 | #48 | Exceptional 11.1% |
| Samoans | 98.7 /100 | #49 | Exceptional 11.1% |
| Serbians | 98.6 /100 | #50 | Exceptional 11.1% |
| Immigrants | North Macedonia | 98.6 /100 | #51 | Exceptional 11.1% |
| Zimbabweans | 98.5 /100 | #52 | Exceptional 11.2% |
| Immigrants | England | 98.4 /100 | #53 | Exceptional 11.2% |
| Afghans | 98.2 /100 | #54 | Exceptional 11.2% |
| Hungarians | 98.1 /100 | #55 | Exceptional 11.2% |
| Slavs | 98.1 /100 | #56 | Exceptional 11.2% |
| Immigrants | Canada | 97.9 /100 | #57 | Exceptional 11.2% |
| Yugoslavians | 97.9 /100 | #58 | Exceptional 11.2% |
Demographics Similar to Jamaicans by Seniors Poverty Over the Age of 75
In terms of seniors poverty over the age of 75, the demographic groups most similar to Jamaicans are Immigrants from Belize (15.2%, a difference of 0.26%), Immigrants from the Azores (15.2%, a difference of 0.28%), Paiute (15.2%, a difference of 0.29%), Colville (15.2%, a difference of 0.48%), and Immigrants from Guatemala (15.1%, a difference of 0.60%).
| Demographics | Rating | Rank | Seniors Poverty Over the Age of 75 |
| Belizeans | 0.0 /100 | #281 | Tragic 14.8% |
| Immigrants | Senegal | 0.0 /100 | #282 | Tragic 14.8% |
| Guatemalans | 0.0 /100 | #283 | Tragic 14.8% |
| Cheyenne | 0.0 /100 | #284 | Tragic 14.9% |
| Immigrants | Mexico | 0.0 /100 | #285 | Tragic 14.9% |
| Immigrants | Central America | 0.0 /100 | #286 | Tragic 15.0% |
| Immigrants | Guatemala | 0.0 /100 | #287 | Tragic 15.1% |
| Jamaicans | 0.0 /100 | #288 | Tragic 15.1% |
| Immigrants | Belize | 0.0 /100 | #289 | Tragic 15.2% |
| Immigrants | Azores | 0.0 /100 | #290 | Tragic 15.2% |
| Paiute | 0.0 /100 | #291 | Tragic 15.2% |
| Colville | 0.0 /100 | #292 | Tragic 15.2% |
| Apache | 0.0 /100 | #293 | Tragic 15.3% |
| Immigrants | Jamaica | 0.0 /100 | #294 | Tragic 15.3% |
| U.S. Virgin Islanders | 0.0 /100 | #295 | Tragic 15.4% |