Immigrants from Nicaragua vs Immigrants from Denmark Seniors Poverty Over the Age of 75
COMPARE
Immigrants from Nicaragua
Immigrants from Denmark
Seniors Poverty Over the Age of 75
Seniors Poverty Over the Age of 75 Comparison
Immigrants from Nicaragua
Immigrants from Denmark
17.6%
SENIORS POVERTY OVER THE AGE OF 75
0.0/ 100
METRIC RATING
333rd/ 347
METRIC RANK
11.8%
SENIORS POVERTY OVER THE AGE OF 75
82.6/ 100
METRIC RATING
127th/ 347
METRIC RANK
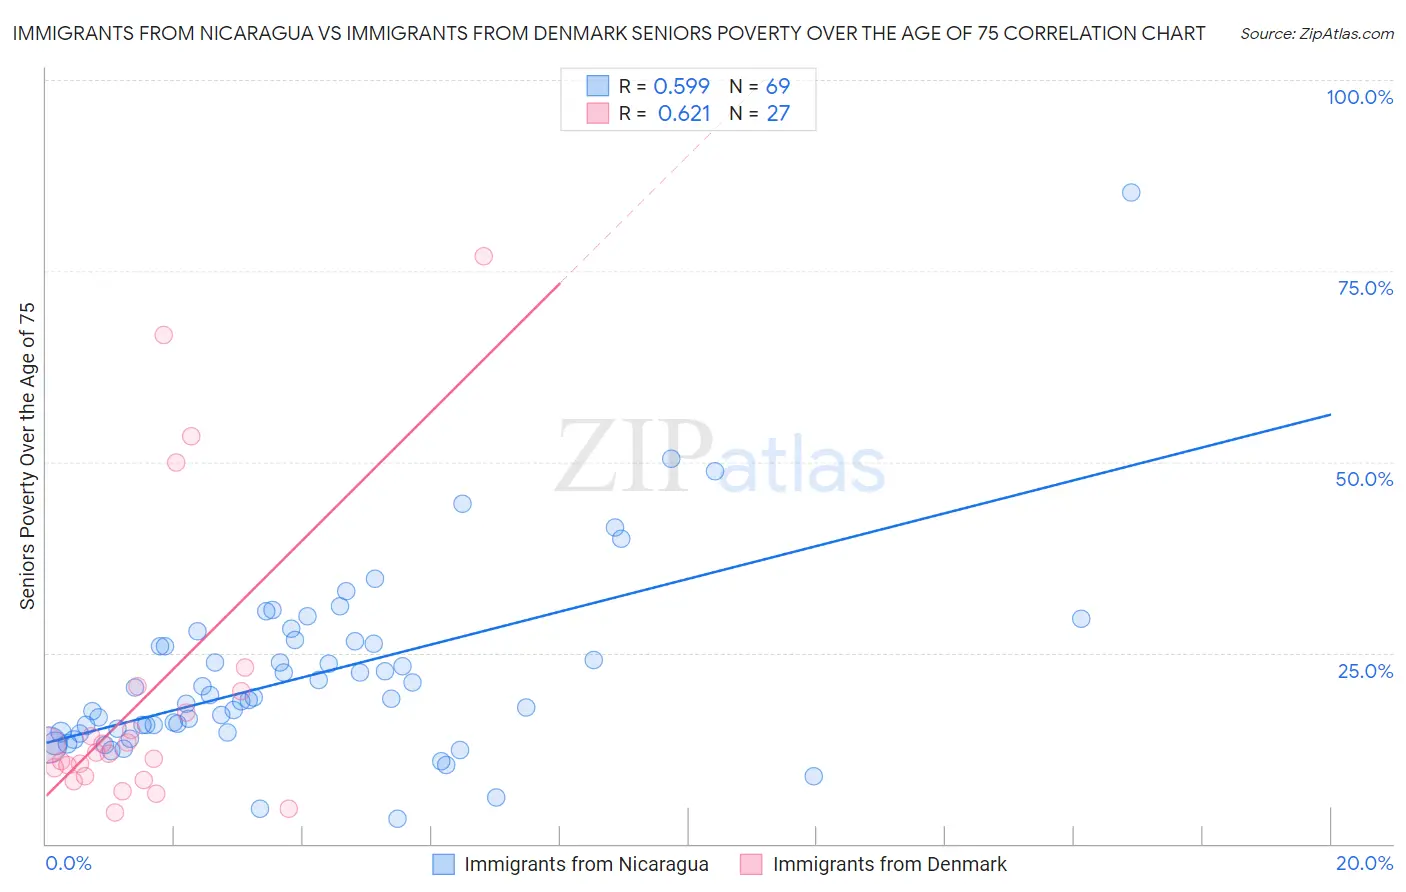
Immigrants from Nicaragua vs Immigrants from Denmark Seniors Poverty Over the Age of 75 Correlation Chart
The statistical analysis conducted on geographies consisting of 235,301,919 people shows a substantial positive correlation between the proportion of Immigrants from Nicaragua and poverty level among seniors over the age of 75 in the United States with a correlation coefficient (R) of 0.599 and weighted average of 17.6%. Similarly, the statistical analysis conducted on geographies consisting of 135,755,105 people shows a significant positive correlation between the proportion of Immigrants from Denmark and poverty level among seniors over the age of 75 in the United States with a correlation coefficient (R) of 0.621 and weighted average of 11.8%, a difference of 49.0%.
Seniors Poverty Over the Age of 75 Correlation Summary
| Measurement | Immigrants from Nicaragua | Immigrants from Denmark |
| Minimum | 3.3% | 4.1% |
| Maximum | 85.2% | 76.9% |
| Range | 82.0% | 72.8% |
| Mean | 22.0% | 19.3% |
| Median | 19.0% | 11.9% |
| Interquartile 25% (IQ1) | 14.6% | 8.9% |
| Interquartile 75% (IQ3) | 26.3% | 20.0% |
| Interquartile Range (IQR) | 11.7% | 11.1% |
| Standard Deviation (Sample) | 12.3% | 19.1% |
| Standard Deviation (Population) | 12.2% | 18.7% |
Similar Demographics by Seniors Poverty Over the Age of 75
Demographics Similar to Immigrants from Nicaragua by Seniors Poverty Over the Age of 75
In terms of seniors poverty over the age of 75, the demographic groups most similar to Immigrants from Nicaragua are Immigrants from St. Vincent and the Grenadines (17.5%, a difference of 0.47%), Immigrants from Armenia (17.5%, a difference of 0.74%), British West Indian (17.4%, a difference of 0.99%), Immigrants from Grenada (17.8%, a difference of 1.5%), and Cuban (18.0%, a difference of 2.1%).
| Demographics | Rating | Rank | Seniors Poverty Over the Age of 75 |
| Pueblo | 0.0 /100 | #326 | Tragic 16.7% |
| Sioux | 0.0 /100 | #327 | Tragic 16.8% |
| Cape Verdeans | 0.0 /100 | #328 | Tragic 16.8% |
| Immigrants | Dominica | 0.0 /100 | #329 | Tragic 17.0% |
| British West Indians | 0.0 /100 | #330 | Tragic 17.4% |
| Immigrants | Armenia | 0.0 /100 | #331 | Tragic 17.5% |
| Immigrants | St. Vincent and the Grenadines | 0.0 /100 | #332 | Tragic 17.5% |
| Immigrants | Nicaragua | 0.0 /100 | #333 | Tragic 17.6% |
| Immigrants | Grenada | 0.0 /100 | #334 | Tragic 17.8% |
| Cubans | 0.0 /100 | #335 | Tragic 18.0% |
| Immigrants | Caribbean | 0.0 /100 | #336 | Tragic 18.2% |
| Yakama | 0.0 /100 | #337 | Tragic 18.3% |
| Immigrants | Cabo Verde | 0.0 /100 | #338 | Tragic 18.5% |
| Hopi | 0.0 /100 | #339 | Tragic 18.9% |
| Tohono O'odham | 0.0 /100 | #340 | Tragic 19.1% |
Demographics Similar to Immigrants from Denmark by Seniors Poverty Over the Age of 75
In terms of seniors poverty over the age of 75, the demographic groups most similar to Immigrants from Denmark are Pennsylvania German (11.8%, a difference of 0.12%), Immigrants from Hungary (11.8%, a difference of 0.12%), Sudanese (11.8%, a difference of 0.16%), Fijian (11.8%, a difference of 0.19%), and Pakistani (11.8%, a difference of 0.22%).
| Demographics | Rating | Rank | Seniors Poverty Over the Age of 75 |
| Immigrants | Nepal | 84.5 /100 | #120 | Excellent 11.8% |
| Malaysians | 84.1 /100 | #121 | Excellent 11.8% |
| Pakistanis | 84.0 /100 | #122 | Excellent 11.8% |
| Immigrants | Italy | 84.0 /100 | #123 | Excellent 11.8% |
| Fijians | 83.8 /100 | #124 | Excellent 11.8% |
| Sudanese | 83.6 /100 | #125 | Excellent 11.8% |
| Pennsylvania Germans | 83.4 /100 | #126 | Excellent 11.8% |
| Immigrants | Denmark | 82.6 /100 | #127 | Excellent 11.8% |
| Immigrants | Hungary | 81.7 /100 | #128 | Excellent 11.8% |
| Ethiopians | 80.7 /100 | #129 | Excellent 11.8% |
| Spanish | 80.5 /100 | #130 | Excellent 11.8% |
| Immigrants | Western Europe | 79.6 /100 | #131 | Good 11.9% |
| Lebanese | 78.3 /100 | #132 | Good 11.9% |
| Immigrants | Sierra Leone | 77.6 /100 | #133 | Good 11.9% |
| Ugandans | 77.1 /100 | #134 | Good 11.9% |