Immigrants from Latvia vs Paraguayan Female Poverty Among 18-24 Year Olds

COMPARE

Immigrants from Latvia
Race
Ancestry
AfghanAfricanAlaska NativeAlaskan AthabascanAlbanianAleutAlsatianAmericanApacheArabArapahoArgentineanArmenianAssyrian/Chaldean/SyriacAustralianAustrianBahamianBangladeshiBarbadianBasqueBelgianBelizeanBermudanBhutaneseBlackfeetBolivianBrazilianBritishBritish West IndianBulgarianBurmeseCajunCambodianCanadianCape VerdeanCarpatho RusynCelticCentral AmericanCentral American IndianCherokeeCheyenneChickasawChileanChineseChippewaChoctawColombianColvilleComancheCosta RicanCreeCreekCroatianCrowCubanCypriotCzechCzechoslovakianDanishDelawareDominicanDutchDutch West IndianEastern EuropeanEcuadorianEgyptianEnglishEstonianEthiopianEuropeanFijianFilipinoFinnishFrenchFrench American IndianFrench CanadianGermanGerman RussianGhanaianGreekGuamanian/ChamorroGuatemalanGuyaneseHaitianHmongHonduranHopiHoumaHungarianIcelanderIndian (Asian)IndonesianInupiatIranianIraqiIrishIroquoisIsraeliItalianJamaicanJapaneseJordanianKenyanKiowaKoreanLaotianLatvianLebaneseLiberianLithuanianLumbeeLuxembourgerMacedonianMalaysianMalteseMarshalleseMenomineeMexicanMexican American IndianMongolianMoroccanNative HawaiianNavajoNepaleseNew ZealanderNicaraguanNigerianNorthern EuropeanNorwegianOkinawanOsageOttawaPaiutePakistaniPalestinianPanamanianPennsylvania GermanPeruvianPimaPolishPortuguesePotawatomiPuebloPuerto RicanPuget Sound SalishRomanianRussianSalvadoranSamoanScandinavianScotch-IrishScottishSeminoleSenegaleseSerbianShoshoneSierra LeoneanSiouxSlavicSlovakSloveneSomaliSouth AfricanSouth AmericanSouth American IndianSoviet UnionSpaniardSpanishSpanish AmericanSpanish American IndianSri LankanSubsaharan AfricanSudaneseSwedishSwissSyrianTaiwaneseThaiTlingit-HaidaTohono O'OdhamTonganTrinidadian and TobagonianTsimshianTurkishU.S. Virgin IslanderUgandanUkrainianUruguayanUteVenezuelanVietnameseWelshWest IndianYakamaYaquiYugoslavianYumanYup'ikZimbabwean
Immigration
NonimmigrantsImmigrantsAfghanistanAfricaAlbaniaArgentinaArmeniaAsiaAustraliaAustriaBahamasBangladeshBarbadosBelarusBelgiumBelizeBoliviaBosnia and HerzegovinaBrazilBulgariaBurma/MyanmarCabo VerdeCambodiaCameroonCanadaCaribbeanCentral AmericaChileChinaColombiaCongoCosta RicaCroatiaCubaCzechoslovakiaDenmarkDominicaDominican RepublicEastern AfricaEastern AsiaEastern EuropeEcuadorEgyptEl SalvadorEnglandEritreaEthiopiaEuropeFijiFranceGermanyGhanaGreeceGrenadaGuatemalaGuyanaHaitiHondurasHong KongHungaryIndiaIndonesiaIranIraqIrelandIsraelItalyJamaicaJapanJordanKazakhstanKenyaKoreaKuwaitLaosLatin AmericaLatviaLebanonLiberiaLithuaniaMalaysiaMexicoMicronesiaMiddle AfricaMoldovaMoroccoNepalNetherlandsNicaraguaNigeriaNorth AmericaNorth MacedoniaNorthern AfricaNorthern EuropeNorwayOceaniaPakistanPanamaPeruPhilippinesPolandPortugalRomaniaRussiaSaudi ArabiaScotlandSenegalSerbiaSierra LeoneSingaporeSomaliaSouth AfricaSouth AmericaSouth Central AsiaSouth Eastern AsiaSouthern EuropeSpainSri LankaSt. Vincent and the GrenadinesSudanSwedenSwitzerlandSyriaTaiwanThailandTrinidad and TobagoTurkeyUgandaUkraineUruguayUzbekistanVenezuelaVietnamWest IndiesWestern AfricaWestern AsiaWestern EuropeYemenZaireZimbabweAzores
Paraguayan
Race
Ancestry
AfghanAfricanAlaska NativeAlaskan AthabascanAlbanianAleutAlsatianAmericanApacheArabArapahoArgentineanArmenianAssyrian/Chaldean/SyriacAustralianAustrianBahamianBangladeshiBarbadianBasqueBelgianBelizeanBermudanBhutaneseBlackfeetBolivianBrazilianBritishBritish West IndianBulgarianBurmeseCajunCambodianCanadianCape VerdeanCarpatho RusynCelticCentral AmericanCentral American IndianCherokeeCheyenneChickasawChileanChineseChippewaChoctawColombianColvilleComancheCosta RicanCreeCreekCroatianCrowCubanCypriotCzechCzechoslovakianDanishDelawareDominicanDutchDutch West IndianEastern EuropeanEcuadorianEgyptianEnglishEstonianEthiopianEuropeanFijianFilipinoFinnishFrenchFrench American IndianFrench CanadianGermanGerman RussianGhanaianGreekGuamanian/ChamorroGuatemalanGuyaneseHaitianHmongHonduranHopiHoumaHungarianIcelanderIndian (Asian)IndonesianInupiatIranianIraqiIrishIroquoisIsraeliItalianJamaicanJapaneseJordanianKenyanKiowaKoreanLaotianLatvianLebaneseLiberianLithuanianLumbeeLuxembourgerMacedonianMalaysianMalteseMarshalleseMenomineeMexicanMexican American IndianMongolianMoroccanNative HawaiianNavajoNepaleseNew ZealanderNicaraguanNigerianNorthern EuropeanNorwegianOkinawanOsageOttawaPaiutePakistaniPalestinianPanamanianParaguayanPennsylvania GermanPeruvianPimaPolishPortuguesePotawatomiPuebloPuerto RicanPuget Sound SalishRomanianRussianSalvadoranSamoanScandinavianScotch-IrishScottishSeminoleSenegaleseSerbianShoshoneSierra LeoneanSiouxSlavicSlovakSloveneSomaliSouth AfricanSouth AmericanSouth American IndianSoviet UnionSpaniardSpanishSpanish AmericanSpanish American IndianSri LankanSubsaharan AfricanSudaneseSwedishSwissSyrianTaiwaneseThaiTlingit-HaidaTohono O'OdhamTonganTrinidadian and TobagonianTsimshianTurkishU.S. Virgin IslanderUgandanUkrainianUruguayanUteVenezuelanVietnameseWelshWest IndianYakamaYaquiYugoslavianYumanYup'ikZimbabwean
Immigration
NonimmigrantsImmigrantsAfghanistanAfricaAlbaniaArgentinaArmeniaAsiaAustraliaAustriaBahamasBangladeshBarbadosBelarusBelgiumBelizeBoliviaBosnia and HerzegovinaBrazilBulgariaBurma/MyanmarCabo VerdeCambodiaCameroonCanadaCaribbeanCentral AmericaChileChinaColombiaCongoCosta RicaCroatiaCubaCzechoslovakiaDenmarkDominicaDominican RepublicEastern AfricaEastern AsiaEastern EuropeEcuadorEgyptEl SalvadorEnglandEritreaEthiopiaEuropeFijiFranceGermanyGhanaGreeceGrenadaGuatemalaGuyanaHaitiHondurasHong KongHungaryIndiaIndonesiaIranIraqIrelandIsraelItalyJamaicaJapanJordanKazakhstanKenyaKoreaKuwaitLaosLatin AmericaLebanonLiberiaLithuaniaMalaysiaMexicoMicronesiaMiddle AfricaMoldovaMoroccoNepalNetherlandsNicaraguaNigeriaNorth AmericaNorth MacedoniaNorthern AfricaNorthern EuropeNorwayOceaniaPakistanPanamaPeruPhilippinesPolandPortugalRomaniaRussiaSaudi ArabiaScotlandSenegalSerbiaSierra LeoneSingaporeSomaliaSouth AfricaSouth AmericaSouth Central AsiaSouth Eastern AsiaSouthern EuropeSpainSri LankaSt. Vincent and the GrenadinesSudanSwedenSwitzerlandSyriaTaiwanThailandTrinidad and TobagoTurkeyUgandaUkraineUruguayUzbekistanVenezuelaVietnamWest IndiesWestern AfricaWestern AsiaWestern EuropeYemenZaireZimbabweAzores
Female Poverty Among 18-24 Year Olds
Income
Poverty
Unemployment
Labor Participation
Family Structure
Vehicle Availability
Education Level
Disability

Female Poverty Among 18-24 Year Olds Comparison

Immigrants from Latvia

Paraguayans

Fair
Exceptional
20.4%
FEMALE POVERTY AMONG 18-24 YEAR OLDS
23.0/ 100
METRIC RATING
195th/ 347
METRIC RANK
19.4%
FEMALE POVERTY AMONG 18-24 YEAR OLDS
94.6/ 100
METRIC RATING
123rd/ 347
METRIC RANK

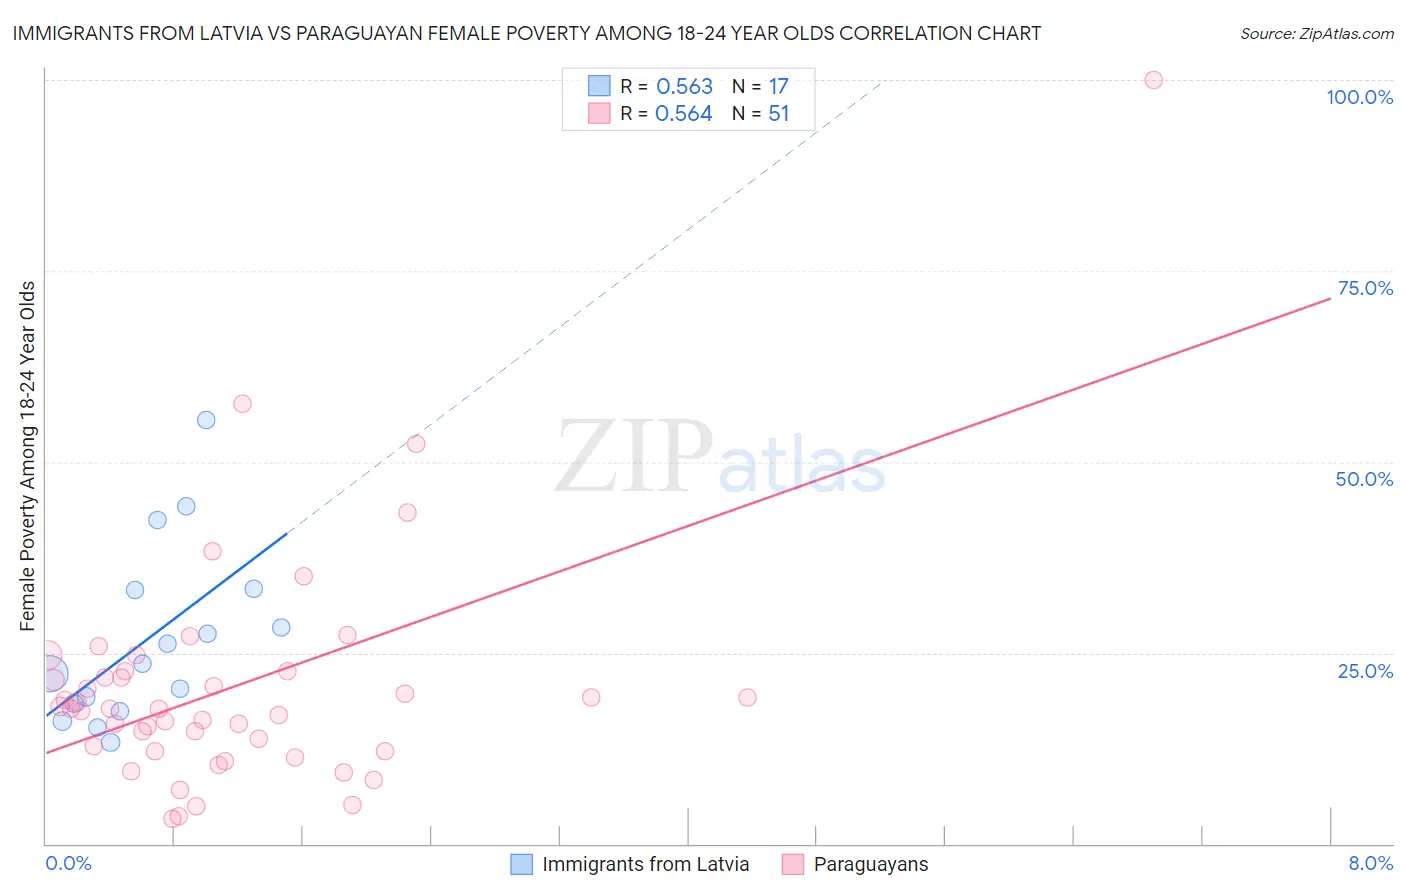
Immigrants from Latvia vs Paraguayan Female Poverty Among 18-24 Year Olds Correlation Chart

The statistical analysis conducted on geographies consisting of 112,426,686 people shows a substantial positive correlation between the proportion of Immigrants from Latvia and poverty level among females between the ages 18 and 24 in the United States with a correlation coefficient (R) of 0.563 and weighted average of 20.4%. Similarly, the statistical analysis conducted on geographies consisting of 94,427,228 people shows a substantial positive correlation between the proportion of Paraguayans and poverty level among females between the ages 18 and 24 in the United States with a correlation coefficient (R) of 0.564 and weighted average of 19.4%, a difference of 5.1%.
Immigrants from Latvia vs Paraguayan Female Poverty Among 18-24 Year Olds

Female Poverty Among 18-24 Year Olds Correlation Summary

MeasurementImmigrants from LatviaParaguayan
Minimum13.2%3.3%
Maximum55.5%100.0%
Range42.3%96.7%
Mean26.8%20.6%
Median23.5%17.7%
Interquartile 25% (IQ1)17.9%12.2%
Interquartile 75% (IQ3)33.3%22.5%
Interquartile Range (IQR)15.4%10.4%
Standard Deviation (Sample)11.7%15.7%
Standard Deviation (Population)11.3%15.6%

Similar Demographics by Female Poverty Among 18-24 Year Olds

Demographics Similar to Immigrants from Latvia by Female Poverty Among 18-24 Year Olds

In terms of female poverty among 18-24 year olds, the demographic groups most similar to Immigrants from Latvia are Mexican American Indian (20.4%, a difference of 0.010%), Nigerian (20.4%, a difference of 0.030%), Czech (20.4%, a difference of 0.050%), Immigrants from Israel (20.4%, a difference of 0.10%), and Zimbabwean (20.4%, a difference of 0.14%).
DemographicsRating | RankFemale Poverty Among 18-24 Year Olds
Scandinavians
34.6
/100
|
#188
Fair
20.3%
Immigrants | Germany
34.0
/100
|
#189
Fair
20.3%
Immigrants | Western Asia
29.3
/100
|
#190
Fair
20.3%
Moroccans
25.8
/100
|
#191
Fair
20.4%
Immigrants | Israel
24.4
/100
|
#192
Fair
20.4%
Nigerians
23.4
/100
|
#193
Fair
20.4%
Mexican American Indians
23.2
/100
|
#194
Fair
20.4%
Immigrants | Latvia
23.0
/100
|
#195
Fair
20.4%
Czechs
22.3
/100
|
#196
Fair
20.4%
Zimbabweans
21.0
/100
|
#197
Fair
20.4%
Immigrants | Spain
20.7
/100
|
#198
Fair
20.4%
Germans
20.6
/100
|
#199
Fair
20.4%
Europeans
19.9
/100
|
#200
Poor
20.4%
Mexicans
18.3
/100
|
#201
Poor
20.5%
Immigrants | Turkey
17.7
/100
|
#202
Poor
20.5%

Demographics Similar to Paraguayans by Female Poverty Among 18-24 Year Olds

In terms of female poverty among 18-24 year olds, the demographic groups most similar to Paraguayans are Cambodian (19.4%, a difference of 0.010%), Immigrants from Chile (19.4%, a difference of 0.070%), Immigrants from Panama (19.4%, a difference of 0.13%), Guyanese (19.4%, a difference of 0.20%), and Immigrants from Russia (19.4%, a difference of 0.20%).
DemographicsRating | RankFemale Poverty Among 18-24 Year Olds
Immigrants | Immigrants
95.9
/100
|
#116
Exceptional
19.3%
Immigrants | Iran
95.8
/100
|
#117
Exceptional
19.3%
Immigrants | Guyana
95.6
/100
|
#118
Exceptional
19.3%
Cypriots
95.5
/100
|
#119
Exceptional
19.3%
Immigrants | Northern Europe
95.4
/100
|
#120
Exceptional
19.4%
Guyanese
95.3
/100
|
#121
Exceptional
19.4%
Cambodians
94.6
/100
|
#122
Exceptional
19.4%
Paraguayans
94.6
/100
|
#123
Exceptional
19.4%
Immigrants | Chile
94.3
/100
|
#124
Exceptional
19.4%
Immigrants | Panama
94.0
/100
|
#125
Exceptional
19.4%
Immigrants | Russia
93.7
/100
|
#126
Exceptional
19.4%
Cape Verdeans
93.6
/100
|
#127
Exceptional
19.4%
Slovaks
92.9
/100
|
#128
Exceptional
19.5%
Immigrants | England
92.9
/100
|
#129
Exceptional
19.5%
Immigrants | Canada
92.9
/100
|
#130
Exceptional
19.5%