Immigrants from Latin America vs Immigrants from Croatia Female Poverty Among 25-34 Year Olds
COMPARE
Immigrants from Latin America
Immigrants from Croatia
Female Poverty Among 25-34 Year Olds
Female Poverty Among 25-34 Year Olds Comparison
Immigrants from Latin America
Immigrants from Croatia
16.0%
FEMALE POVERTY AMONG 25-34 YEAR OLDS
0.0/ 100
METRIC RATING
281st/ 347
METRIC RANK
12.0%
FEMALE POVERTY AMONG 25-34 YEAR OLDS
99.6/ 100
METRIC RATING
50th/ 347
METRIC RANK
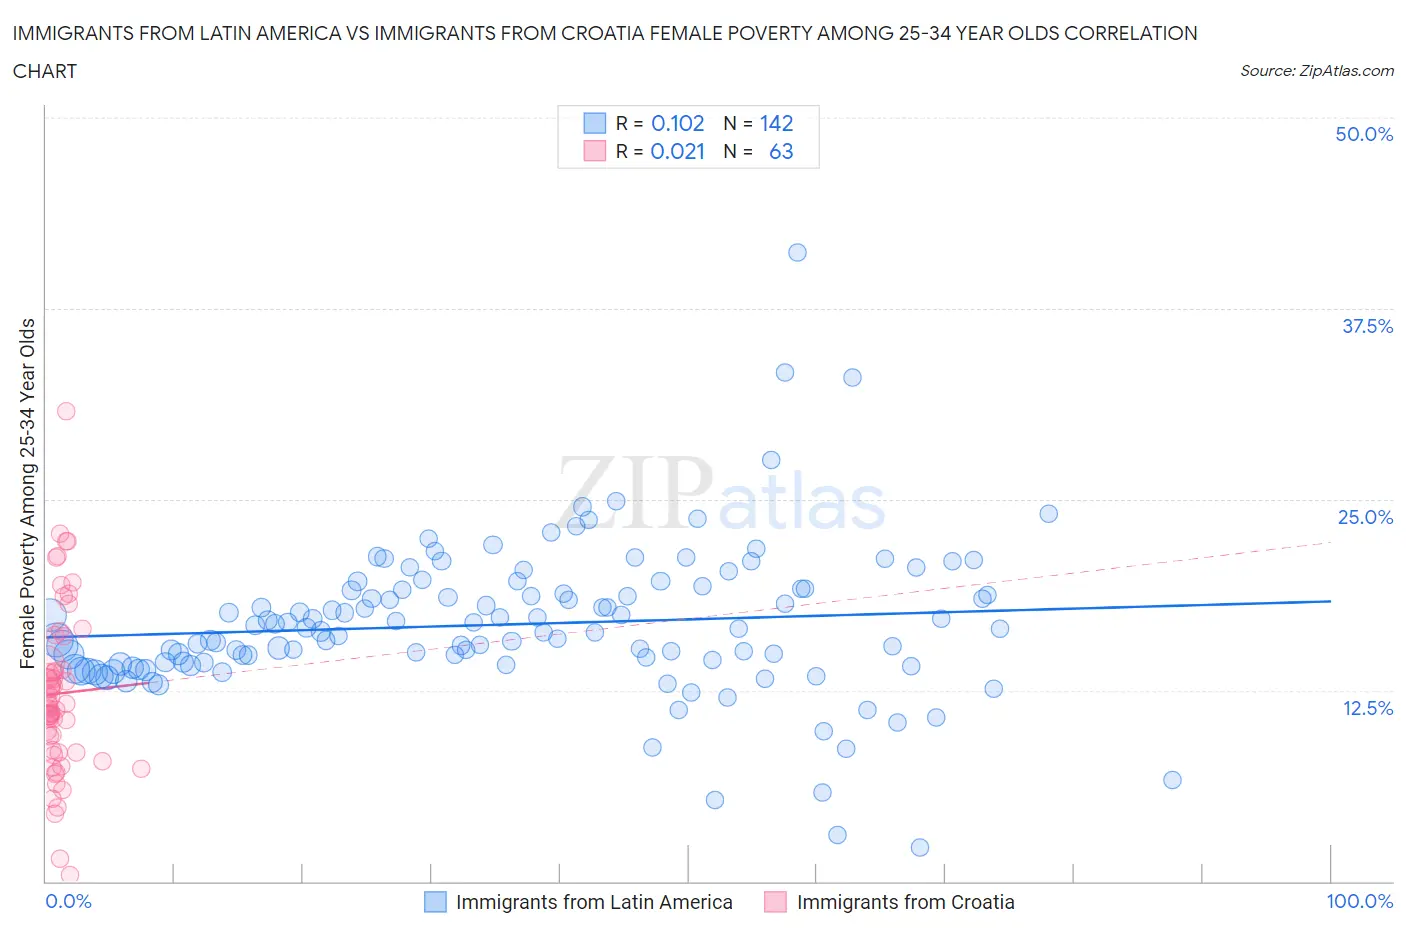
Immigrants from Latin America vs Immigrants from Croatia Female Poverty Among 25-34 Year Olds Correlation Chart
The statistical analysis conducted on geographies consisting of 540,358,744 people shows a poor positive correlation between the proportion of Immigrants from Latin America and poverty level among females between the ages 25 and 34 in the United States with a correlation coefficient (R) of 0.102 and weighted average of 16.0%. Similarly, the statistical analysis conducted on geographies consisting of 131,557,696 people shows no correlation between the proportion of Immigrants from Croatia and poverty level among females between the ages 25 and 34 in the United States with a correlation coefficient (R) of 0.021 and weighted average of 12.0%, a difference of 33.5%.
Female Poverty Among 25-34 Year Olds Correlation Summary
| Measurement | Immigrants from Latin America | Immigrants from Croatia |
| Minimum | 2.2% | 0.42% |
| Maximum | 41.2% | 30.8% |
| Range | 38.9% | 30.3% |
| Mean | 16.8% | 12.3% |
| Median | 16.4% | 11.5% |
| Interquartile 25% (IQ1) | 14.2% | 8.5% |
| Interquartile 75% (IQ3) | 19.1% | 14.2% |
| Interquartile Range (IQR) | 4.9% | 5.8% |
| Standard Deviation (Sample) | 5.0% | 5.5% |
| Standard Deviation (Population) | 4.9% | 5.4% |
Similar Demographics by Female Poverty Among 25-34 Year Olds
Demographics Similar to Immigrants from Latin America by Female Poverty Among 25-34 Year Olds
In terms of female poverty among 25-34 year olds, the demographic groups most similar to Immigrants from Latin America are Bangladeshi (15.9%, a difference of 0.51%), Aleut (16.1%, a difference of 0.66%), French American Indian (15.9%, a difference of 0.67%), Fijian (15.9%, a difference of 0.67%), and Bahamian (16.1%, a difference of 0.69%).
| Demographics | Rating | Rank | Female Poverty Among 25-34 Year Olds |
| Immigrants | Caribbean | 0.0 /100 | #274 | Tragic 15.7% |
| Immigrants | Azores | 0.0 /100 | #275 | Tragic 15.8% |
| Immigrants | Zaire | 0.0 /100 | #276 | Tragic 15.8% |
| Immigrants | Micronesia | 0.0 /100 | #277 | Tragic 15.8% |
| French American Indians | 0.0 /100 | #278 | Tragic 15.9% |
| Fijians | 0.0 /100 | #279 | Tragic 15.9% |
| Bangladeshis | 0.0 /100 | #280 | Tragic 15.9% |
| Immigrants | Latin America | 0.0 /100 | #281 | Tragic 16.0% |
| Aleuts | 0.0 /100 | #282 | Tragic 16.1% |
| Bahamians | 0.0 /100 | #283 | Tragic 16.1% |
| Shoshone | 0.0 /100 | #284 | Tragic 16.2% |
| Immigrants | Bahamas | 0.0 /100 | #285 | Tragic 16.3% |
| Cape Verdeans | 0.0 /100 | #286 | Tragic 16.3% |
| Americans | 0.0 /100 | #287 | Tragic 16.4% |
| Guatemalans | 0.0 /100 | #288 | Tragic 16.4% |
Demographics Similar to Immigrants from Croatia by Female Poverty Among 25-34 Year Olds
In terms of female poverty among 25-34 year olds, the demographic groups most similar to Immigrants from Croatia are Paraguayan (12.0%, a difference of 0.010%), Immigrants from Egypt (12.0%, a difference of 0.020%), Immigrants from Eastern Europe (12.0%, a difference of 0.030%), Immigrants from Belarus (12.0%, a difference of 0.090%), and Korean (12.0%, a difference of 0.15%).
| Demographics | Rating | Rank | Female Poverty Among 25-34 Year Olds |
| Egyptians | 99.7 /100 | #43 | Exceptional 11.9% |
| Immigrants | Australia | 99.7 /100 | #44 | Exceptional 11.9% |
| Macedonians | 99.7 /100 | #45 | Exceptional 11.9% |
| Immigrants | Serbia | 99.7 /100 | #46 | Exceptional 11.9% |
| Koreans | 99.6 /100 | #47 | Exceptional 12.0% |
| Immigrants | Belarus | 99.6 /100 | #48 | Exceptional 12.0% |
| Immigrants | Egypt | 99.6 /100 | #49 | Exceptional 12.0% |
| Immigrants | Croatia | 99.6 /100 | #50 | Exceptional 12.0% |
| Paraguayans | 99.6 /100 | #51 | Exceptional 12.0% |
| Immigrants | Eastern Europe | 99.6 /100 | #52 | Exceptional 12.0% |
| Immigrants | Israel | 99.6 /100 | #53 | Exceptional 12.0% |
| Eastern Europeans | 99.6 /100 | #54 | Exceptional 12.0% |
| Immigrants | Philippines | 99.5 /100 | #55 | Exceptional 12.0% |
| Luxembourgers | 99.5 /100 | #56 | Exceptional 12.1% |
| Jordanians | 99.4 /100 | #57 | Exceptional 12.1% |