Immigrants from Laos vs Hispanic or Latino Receiving Food Stamps
COMPARE
Immigrants from Laos
Hispanic or Latino
Receiving Food Stamps
Receiving Food Stamps Comparison
Immigrants from Laos
Hispanics or Latinos
13.8%
RECEIVING FOOD STAMPS
0.7/ 100
METRIC RATING
248th/ 347
METRIC RANK
15.8%
RECEIVING FOOD STAMPS
0.0/ 100
METRIC RATING
299th/ 347
METRIC RANK
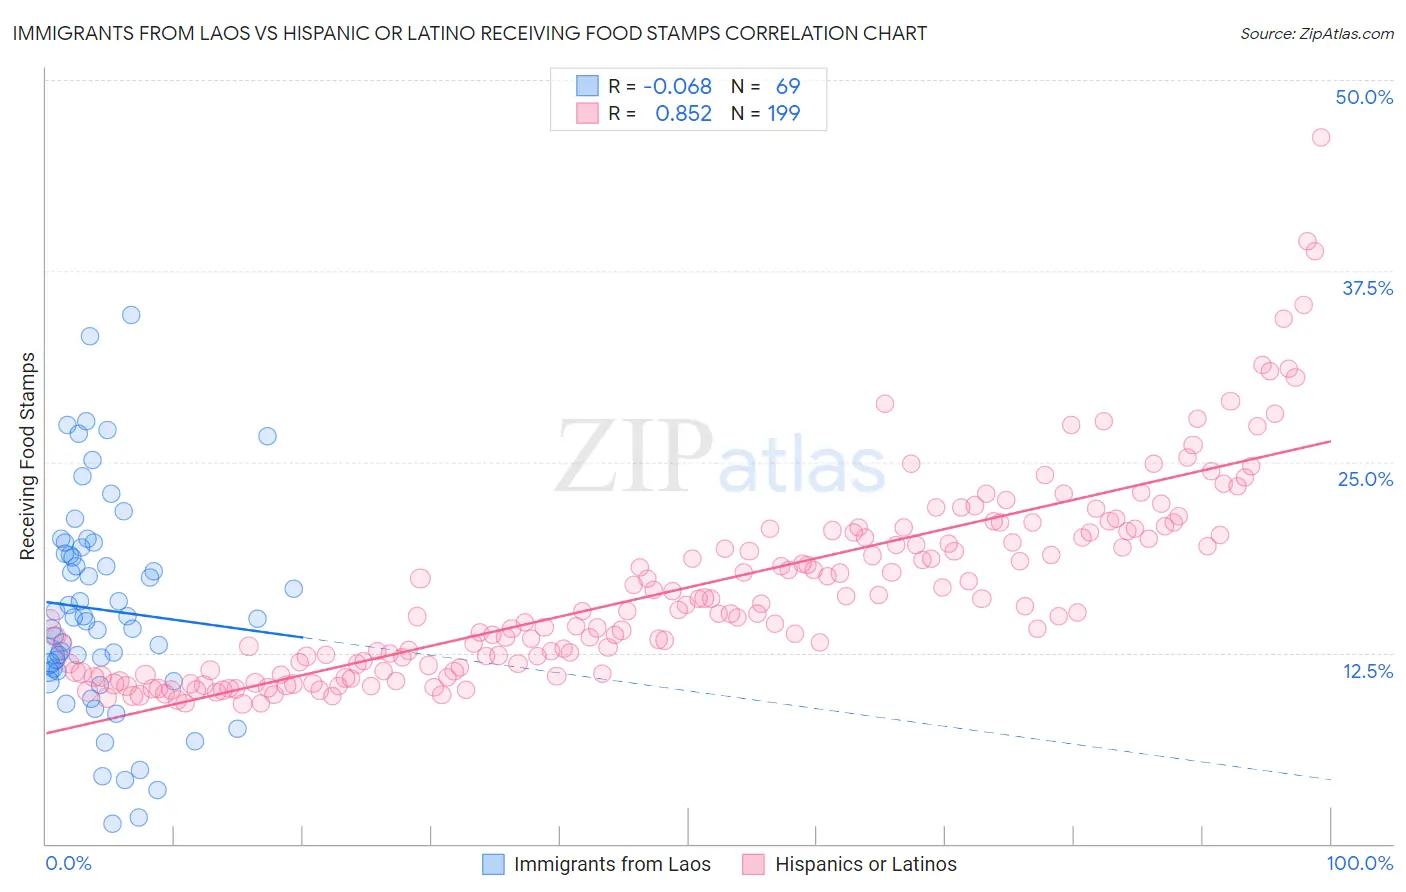
Immigrants from Laos vs Hispanic or Latino Receiving Food Stamps Correlation Chart
The statistical analysis conducted on geographies consisting of 201,380,139 people shows a slight negative correlation between the proportion of Immigrants from Laos and percentage of population receiving government assistance and/or food stamps in the United States with a correlation coefficient (R) of -0.068 and weighted average of 13.8%. Similarly, the statistical analysis conducted on geographies consisting of 573,421,418 people shows a very strong positive correlation between the proportion of Hispanics or Latinos and percentage of population receiving government assistance and/or food stamps in the United States with a correlation coefficient (R) of 0.852 and weighted average of 15.8%, a difference of 15.0%.
Receiving Food Stamps Correlation Summary
| Measurement | Immigrants from Laos | Hispanic or Latino |
| Minimum | 1.3% | 9.2% |
| Maximum | 34.6% | 46.2% |
| Range | 33.3% | 37.1% |
| Mean | 15.3% | 16.7% |
| Median | 14.7% | 15.2% |
| Interquartile 25% (IQ1) | 11.3% | 11.4% |
| Interquartile 75% (IQ3) | 19.2% | 20.4% |
| Interquartile Range (IQR) | 8.0% | 9.0% |
| Standard Deviation (Sample) | 7.0% | 6.5% |
| Standard Deviation (Population) | 6.9% | 6.4% |
Similar Demographics by Receiving Food Stamps
Demographics Similar to Immigrants from Laos by Receiving Food Stamps
In terms of receiving food stamps, the demographic groups most similar to Immigrants from Laos are Mexican American Indian (13.8%, a difference of 0.10%), Cree (13.7%, a difference of 0.36%), Immigrants from Somalia (13.7%, a difference of 0.60%), Indonesian (13.9%, a difference of 0.63%), and Cajun (13.7%, a difference of 0.65%).
| Demographics | Rating | Rank | Receiving Food Stamps |
| Choctaw | 1.0 /100 | #241 | Tragic 13.6% |
| Immigrants | Panama | 1.0 /100 | #242 | Tragic 13.6% |
| Somalis | 0.9 /100 | #243 | Tragic 13.7% |
| Cajuns | 0.9 /100 | #244 | Tragic 13.7% |
| Immigrants | Somalia | 0.9 /100 | #245 | Tragic 13.7% |
| Cree | 0.8 /100 | #246 | Tragic 13.7% |
| Mexican American Indians | 0.7 /100 | #247 | Tragic 13.8% |
| Immigrants | Laos | 0.7 /100 | #248 | Tragic 13.8% |
| Indonesians | 0.6 /100 | #249 | Tragic 13.9% |
| Immigrants | Cambodia | 0.5 /100 | #250 | Tragic 13.9% |
| Yaqui | 0.5 /100 | #251 | Tragic 13.9% |
| Ghanaians | 0.5 /100 | #252 | Tragic 14.0% |
| Spanish Americans | 0.4 /100 | #253 | Tragic 14.0% |
| Marshallese | 0.3 /100 | #254 | Tragic 14.1% |
| Sub-Saharan Africans | 0.3 /100 | #255 | Tragic 14.1% |
Demographics Similar to Hispanics or Latinos by Receiving Food Stamps
In terms of receiving food stamps, the demographic groups most similar to Hispanics or Latinos are Immigrants from Trinidad and Tobago (15.8%, a difference of 0.28%), Immigrants from Bangladesh (15.9%, a difference of 0.43%), Immigrants from Bahamas (15.8%, a difference of 0.53%), Tsimshian (15.7%, a difference of 0.69%), and Immigrants from Honduras (15.7%, a difference of 0.70%).
| Demographics | Rating | Rank | Receiving Food Stamps |
| Alaska Natives | 0.0 /100 | #292 | Tragic 15.6% |
| Vietnamese | 0.0 /100 | #293 | Tragic 15.7% |
| Immigrants | Latin America | 0.0 /100 | #294 | Tragic 15.7% |
| Immigrants | Honduras | 0.0 /100 | #295 | Tragic 15.7% |
| Tsimshian | 0.0 /100 | #296 | Tragic 15.7% |
| Immigrants | Bahamas | 0.0 /100 | #297 | Tragic 15.8% |
| Immigrants | Trinidad and Tobago | 0.0 /100 | #298 | Tragic 15.8% |
| Hispanics or Latinos | 0.0 /100 | #299 | Tragic 15.8% |
| Immigrants | Bangladesh | 0.0 /100 | #300 | Tragic 15.9% |
| Trinidadians and Tobagonians | 0.0 /100 | #301 | Tragic 16.0% |
| Immigrants | West Indies | 0.0 /100 | #302 | Tragic 16.1% |
| Nicaraguans | 0.0 /100 | #303 | Tragic 16.1% |
| West Indians | 0.0 /100 | #304 | Tragic 16.3% |
| Immigrants | Azores | 0.0 /100 | #305 | Tragic 16.4% |
| Jamaicans | 0.0 /100 | #306 | Tragic 16.4% |