Immigrants from Kuwait vs Immigrants from Portugal Seniors Poverty Over the Age of 75
COMPARE
Immigrants from Kuwait
Immigrants from Portugal
Seniors Poverty Over the Age of 75
Seniors Poverty Over the Age of 75 Comparison
Immigrants from Kuwait
Immigrants from Portugal
11.6%
SENIORS POVERTY OVER THE AGE OF 75
90.5/ 100
METRIC RATING
103rd/ 347
METRIC RANK
13.9%
SENIORS POVERTY OVER THE AGE OF 75
0.1/ 100
METRIC RATING
259th/ 347
METRIC RANK
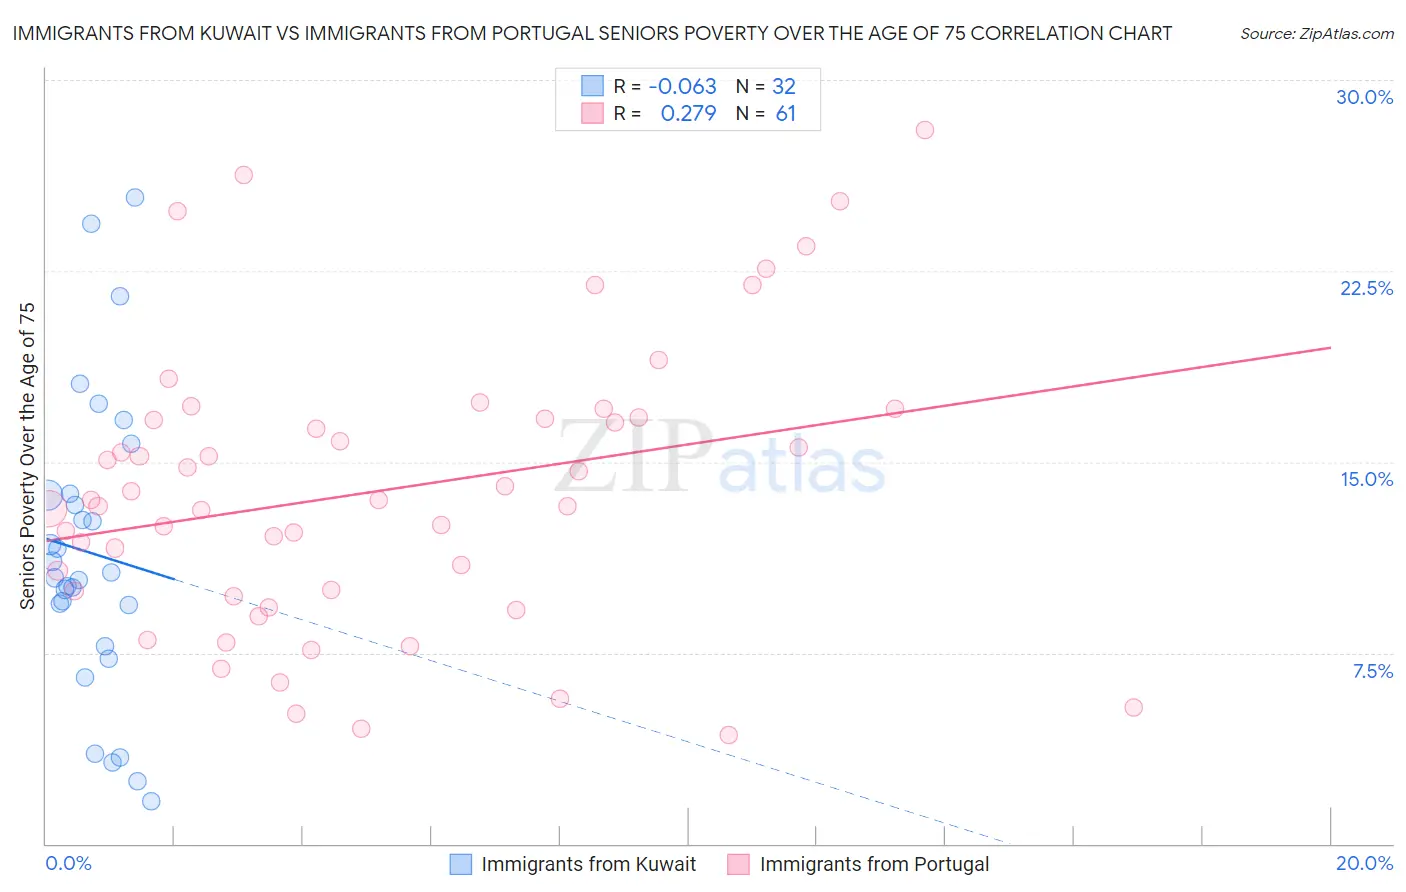
Immigrants from Kuwait vs Immigrants from Portugal Seniors Poverty Over the Age of 75 Correlation Chart
The statistical analysis conducted on geographies consisting of 136,522,222 people shows a slight negative correlation between the proportion of Immigrants from Kuwait and poverty level among seniors over the age of 75 in the United States with a correlation coefficient (R) of -0.063 and weighted average of 11.6%. Similarly, the statistical analysis conducted on geographies consisting of 173,762,131 people shows a weak positive correlation between the proportion of Immigrants from Portugal and poverty level among seniors over the age of 75 in the United States with a correlation coefficient (R) of 0.279 and weighted average of 13.9%, a difference of 19.8%.
Seniors Poverty Over the Age of 75 Correlation Summary
| Measurement | Immigrants from Kuwait | Immigrants from Portugal |
| Minimum | 1.7% | 4.3% |
| Maximum | 25.4% | 28.0% |
| Range | 23.7% | 23.8% |
| Mean | 11.4% | 13.9% |
| Median | 10.5% | 13.5% |
| Interquartile 25% (IQ1) | 8.6% | 9.8% |
| Interquartile 75% (IQ3) | 13.7% | 16.7% |
| Interquartile Range (IQR) | 5.1% | 6.9% |
| Standard Deviation (Sample) | 5.8% | 5.6% |
| Standard Deviation (Population) | 5.7% | 5.5% |
Similar Demographics by Seniors Poverty Over the Age of 75
Demographics Similar to Immigrants from Kuwait by Seniors Poverty Over the Age of 75
In terms of seniors poverty over the age of 75, the demographic groups most similar to Immigrants from Kuwait are Guamanian/Chamorro (11.6%, a difference of 0.040%), Immigrants from Singapore (11.6%, a difference of 0.050%), Chickasaw (11.6%, a difference of 0.060%), Jordanian (11.6%, a difference of 0.080%), and Russian (11.6%, a difference of 0.14%).
| Demographics | Rating | Rank | Seniors Poverty Over the Age of 75 |
| Immigrants | Sweden | 92.6 /100 | #96 | Exceptional 11.6% |
| Romanians | 92.3 /100 | #97 | Exceptional 11.6% |
| Immigrants | Japan | 91.9 /100 | #98 | Exceptional 11.6% |
| Immigrants | Ethiopia | 91.7 /100 | #99 | Exceptional 11.6% |
| Syrians | 91.1 /100 | #100 | Exceptional 11.6% |
| Jordanians | 90.8 /100 | #101 | Exceptional 11.6% |
| Guamanians/Chamorros | 90.6 /100 | #102 | Exceptional 11.6% |
| Immigrants | Kuwait | 90.5 /100 | #103 | Exceptional 11.6% |
| Immigrants | Singapore | 90.3 /100 | #104 | Exceptional 11.6% |
| Chickasaw | 90.2 /100 | #105 | Exceptional 11.6% |
| Russians | 89.9 /100 | #106 | Excellent 11.6% |
| Immigrants | Oceania | 89.4 /100 | #107 | Excellent 11.7% |
| Turks | 89.4 /100 | #108 | Excellent 11.7% |
| South Africans | 89.3 /100 | #109 | Excellent 11.7% |
| Immigrants | Jordan | 88.7 /100 | #110 | Excellent 11.7% |
Demographics Similar to Immigrants from Portugal by Seniors Poverty Over the Age of 75
In terms of seniors poverty over the age of 75, the demographic groups most similar to Immigrants from Portugal are Immigrants from Panama (13.9%, a difference of 0.040%), Immigrants (13.9%, a difference of 0.070%), Immigrants from Western Africa (13.9%, a difference of 0.13%), Ghanaian (14.0%, a difference of 0.17%), and Cajun (14.0%, a difference of 0.40%).
| Demographics | Rating | Rank | Seniors Poverty Over the Age of 75 |
| Immigrants | Argentina | 0.3 /100 | #252 | Tragic 13.7% |
| Immigrants | Spain | 0.2 /100 | #253 | Tragic 13.7% |
| Blackfeet | 0.2 /100 | #254 | Tragic 13.7% |
| Immigrants | Belarus | 0.2 /100 | #255 | Tragic 13.8% |
| Inupiat | 0.1 /100 | #256 | Tragic 13.8% |
| Immigrants | Western Africa | 0.1 /100 | #257 | Tragic 13.9% |
| Immigrants | Panama | 0.1 /100 | #258 | Tragic 13.9% |
| Immigrants | Portugal | 0.1 /100 | #259 | Tragic 13.9% |
| Immigrants | Immigrants | 0.1 /100 | #260 | Tragic 13.9% |
| Ghanaians | 0.1 /100 | #261 | Tragic 14.0% |
| Cajuns | 0.1 /100 | #262 | Tragic 14.0% |
| Iroquois | 0.1 /100 | #263 | Tragic 14.0% |
| South Americans | 0.0 /100 | #264 | Tragic 14.1% |
| Salvadorans | 0.0 /100 | #265 | Tragic 14.2% |
| Armenians | 0.0 /100 | #266 | Tragic 14.2% |