Immigrants from Iraq vs Immigrants from Denmark Seniors Poverty Over the Age of 65
COMPARE
Immigrants from Iraq
Immigrants from Denmark
Seniors Poverty Over the Age of 65
Seniors Poverty Over the Age of 65 Comparison
Immigrants from Iraq
Immigrants from Denmark
10.4%
SENIORS POVERTY OVER THE AGE OF 65
90.7/ 100
METRIC RATING
121st/ 347
METRIC RANK
10.3%
SENIORS POVERTY OVER THE AGE OF 65
92.7/ 100
METRIC RATING
114th/ 347
METRIC RANK
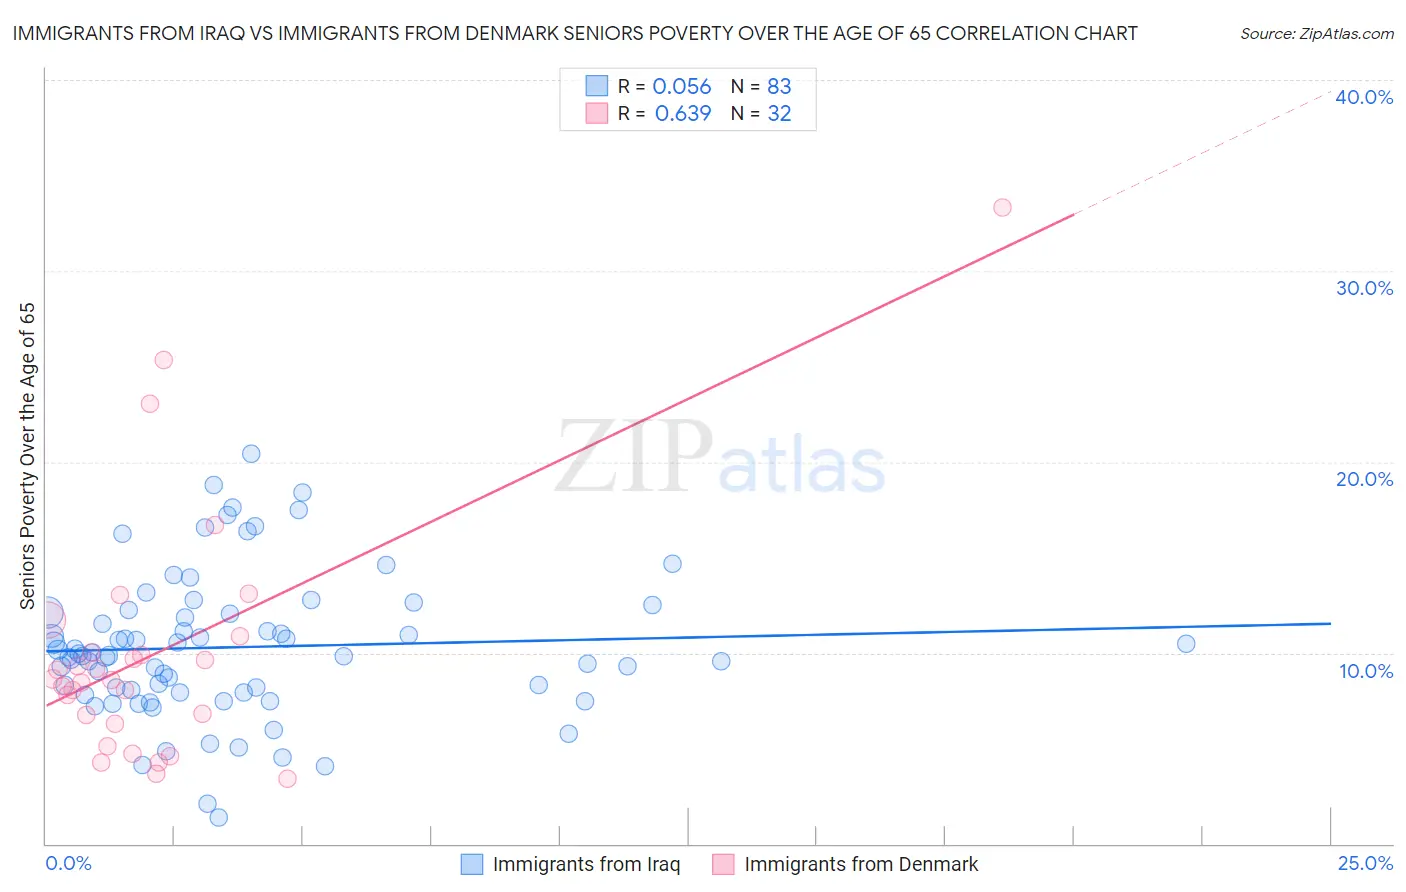
Immigrants from Iraq vs Immigrants from Denmark Seniors Poverty Over the Age of 65 Correlation Chart
The statistical analysis conducted on geographies consisting of 194,618,212 people shows a slight positive correlation between the proportion of Immigrants from Iraq and poverty level among seniors over the age of 65 in the United States with a correlation coefficient (R) of 0.056 and weighted average of 10.4%. Similarly, the statistical analysis conducted on geographies consisting of 136,262,955 people shows a significant positive correlation between the proportion of Immigrants from Denmark and poverty level among seniors over the age of 65 in the United States with a correlation coefficient (R) of 0.639 and weighted average of 10.3%, a difference of 0.63%.
Seniors Poverty Over the Age of 65 Correlation Summary
| Measurement | Immigrants from Iraq | Immigrants from Denmark |
| Minimum | 1.3% | 3.4% |
| Maximum | 20.4% | 33.3% |
| Range | 19.1% | 30.0% |
| Mean | 10.3% | 10.0% |
| Median | 9.9% | 8.6% |
| Interquartile 25% (IQ1) | 7.9% | 6.5% |
| Interquartile 75% (IQ3) | 12.1% | 10.5% |
| Interquartile Range (IQR) | 4.2% | 4.0% |
| Standard Deviation (Sample) | 3.8% | 6.5% |
| Standard Deviation (Population) | 3.7% | 6.4% |
Demographics Similar to Immigrants from Iraq and Immigrants from Denmark by Seniors Poverty Over the Age of 65
In terms of seniors poverty over the age of 65, the demographic groups most similar to Immigrants from Iraq are Immigrants from Moldova (10.4%, a difference of 0.0%), Immigrants from Bosnia and Herzegovina (10.4%, a difference of 0.040%), Immigrants from Western Europe (10.4%, a difference of 0.10%), Hmong (10.4%, a difference of 0.18%), and Asian (10.4%, a difference of 0.21%). Similarly, the demographic groups most similar to Immigrants from Denmark are Immigrants from Italy (10.3%, a difference of 0.040%), Immigrants from Romania (10.3%, a difference of 0.19%), Pakistani (10.3%, a difference of 0.19%), Immigrants from Korea (10.3%, a difference of 0.23%), and Immigrants from Belgium (10.3%, a difference of 0.25%).
| Demographics | Rating | Rank | Seniors Poverty Over the Age of 65 |
| Hawaiians | 93.9 /100 | #107 | Exceptional 10.3% |
| Immigrants | Croatia | 93.9 /100 | #108 | Exceptional 10.3% |
| Syrians | 93.8 /100 | #109 | Exceptional 10.3% |
| Immigrants | Zimbabwe | 93.5 /100 | #110 | Exceptional 10.3% |
| Immigrants | Belgium | 93.4 /100 | #111 | Exceptional 10.3% |
| Immigrants | Korea | 93.3 /100 | #112 | Exceptional 10.3% |
| Immigrants | Romania | 93.3 /100 | #113 | Exceptional 10.3% |
| Immigrants | Denmark | 92.7 /100 | #114 | Exceptional 10.3% |
| Immigrants | Italy | 92.6 /100 | #115 | Exceptional 10.3% |
| Pakistanis | 92.2 /100 | #116 | Exceptional 10.3% |
| Lebanese | 92.0 /100 | #117 | Exceptional 10.3% |
| Okinawans | 91.7 /100 | #118 | Exceptional 10.4% |
| Immigrants | Western Europe | 91.1 /100 | #119 | Exceptional 10.4% |
| Immigrants | Bosnia and Herzegovina | 90.8 /100 | #120 | Exceptional 10.4% |
| Immigrants | Iraq | 90.7 /100 | #121 | Exceptional 10.4% |
| Immigrants | Moldova | 90.7 /100 | #122 | Exceptional 10.4% |
| Hmong | 90.0 /100 | #123 | Exceptional 10.4% |
| Asians | 89.9 /100 | #124 | Excellent 10.4% |
| Immigrants | Philippines | 89.4 /100 | #125 | Excellent 10.4% |
| Immigrants | Hungary | 89.1 /100 | #126 | Excellent 10.4% |
| Cambodians | 89.1 /100 | #127 | Excellent 10.4% |