Immigrants from Iran vs Chippewa Child Poverty Under the Age of 5
COMPARE
Immigrants from Iran
Chippewa
Child Poverty Under the Age of 5
Child Poverty Under the Age of 5 Comparison
Immigrants from Iran
Chippewa
13.1%
CHILD POVERTY UNDER THE AGE OF 5
100.0/ 100
METRIC RATING
9th/ 347
METRIC RANK
23.4%
CHILD POVERTY UNDER THE AGE OF 5
0.0/ 100
METRIC RATING
319th/ 347
METRIC RANK
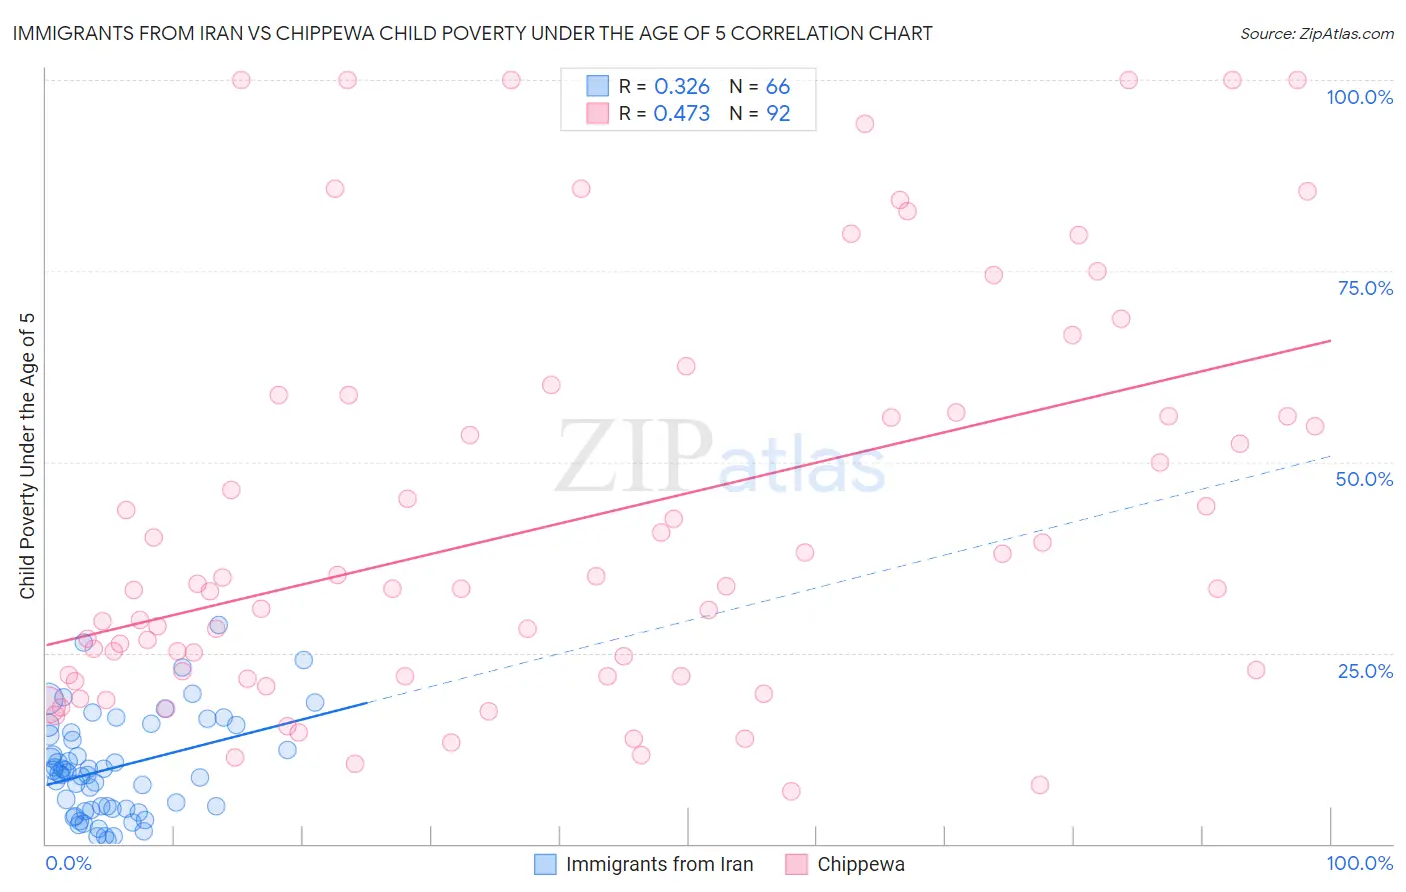
Immigrants from Iran vs Chippewa Child Poverty Under the Age of 5 Correlation Chart
The statistical analysis conducted on geographies consisting of 269,372,648 people shows a mild positive correlation between the proportion of Immigrants from Iran and poverty level among children under the age of 5 in the United States with a correlation coefficient (R) of 0.326 and weighted average of 13.1%. Similarly, the statistical analysis conducted on geographies consisting of 210,183,643 people shows a moderate positive correlation between the proportion of Chippewa and poverty level among children under the age of 5 in the United States with a correlation coefficient (R) of 0.473 and weighted average of 23.4%, a difference of 78.8%.
Child Poverty Under the Age of 5 Correlation Summary
| Measurement | Immigrants from Iran | Chippewa |
| Minimum | 0.42% | 6.9% |
| Maximum | 28.6% | 100.0% |
| Range | 28.2% | 93.1% |
| Mean | 10.0% | 42.0% |
| Median | 9.3% | 33.3% |
| Interquartile 25% (IQ1) | 4.6% | 22.0% |
| Interquartile 75% (IQ3) | 14.6% | 56.2% |
| Interquartile Range (IQR) | 10.0% | 34.2% |
| Standard Deviation (Sample) | 6.6% | 26.2% |
| Standard Deviation (Population) | 6.5% | 26.0% |
Similar Demographics by Child Poverty Under the Age of 5
Demographics Similar to Immigrants from Iran by Child Poverty Under the Age of 5
In terms of child poverty under the age of 5, the demographic groups most similar to Immigrants from Iran are Iranian (13.1%, a difference of 0.16%), Chinese (13.1%, a difference of 0.17%), Burmese (13.2%, a difference of 1.1%), Immigrants from Singapore (12.9%, a difference of 1.2%), and Immigrants from Korea (13.2%, a difference of 1.2%).
| Demographics | Rating | Rank | Child Poverty Under the Age of 5 |
| Immigrants | Taiwan | 100.0 /100 | #2 | Exceptional 11.6% |
| Filipinos | 100.0 /100 | #3 | Exceptional 11.6% |
| Thais | 100.0 /100 | #4 | Exceptional 12.3% |
| Immigrants | Hong Kong | 100.0 /100 | #5 | Exceptional 12.4% |
| Immigrants | Singapore | 100.0 /100 | #6 | Exceptional 12.9% |
| Chinese | 100.0 /100 | #7 | Exceptional 13.1% |
| Iranians | 100.0 /100 | #8 | Exceptional 13.1% |
| Immigrants | Iran | 100.0 /100 | #9 | Exceptional 13.1% |
| Burmese | 100.0 /100 | #10 | Exceptional 13.2% |
| Immigrants | Korea | 100.0 /100 | #11 | Exceptional 13.2% |
| Immigrants | South Central Asia | 100.0 /100 | #12 | Exceptional 13.3% |
| Bhutanese | 100.0 /100 | #13 | Exceptional 13.4% |
| Okinawans | 100.0 /100 | #14 | Exceptional 13.4% |
| Indians (Asian) | 100.0 /100 | #15 | Exceptional 13.4% |
| Immigrants | Eastern Asia | 100.0 /100 | #16 | Exceptional 13.5% |
Demographics Similar to Chippewa by Child Poverty Under the Age of 5
In terms of child poverty under the age of 5, the demographic groups most similar to Chippewa are Choctaw (23.5%, a difference of 0.38%), Immigrants from Honduras (23.5%, a difference of 0.41%), Dutch West Indian (23.3%, a difference of 0.48%), Menominee (23.3%, a difference of 0.58%), and Ute (23.5%, a difference of 0.64%).
| Demographics | Rating | Rank | Child Poverty Under the Age of 5 |
| Hondurans | 0.0 /100 | #312 | Tragic 23.0% |
| Bahamians | 0.0 /100 | #313 | Tragic 23.0% |
| U.S. Virgin Islanders | 0.0 /100 | #314 | Tragic 23.0% |
| Arapaho | 0.0 /100 | #315 | Tragic 23.1% |
| Yakama | 0.0 /100 | #316 | Tragic 23.1% |
| Menominee | 0.0 /100 | #317 | Tragic 23.3% |
| Dutch West Indians | 0.0 /100 | #318 | Tragic 23.3% |
| Chippewa | 0.0 /100 | #319 | Tragic 23.4% |
| Choctaw | 0.0 /100 | #320 | Tragic 23.5% |
| Immigrants | Honduras | 0.0 /100 | #321 | Tragic 23.5% |
| Ute | 0.0 /100 | #322 | Tragic 23.5% |
| Pueblo | 0.0 /100 | #323 | Tragic 23.7% |
| Paiute | 0.0 /100 | #324 | Tragic 23.8% |
| Immigrants | Congo | 0.0 /100 | #325 | Tragic 23.9% |
| Central American Indians | 0.0 /100 | #326 | Tragic 23.9% |