Immigrants from Indonesia vs Immigrants from Western Africa Child Poverty Under the Age of 5

COMPARE

Immigrants from Indonesia
Race
Ancestry
AfghanAfricanAlaska NativeAlaskan AthabascanAlbanianAleutAlsatianAmericanApacheArabArapahoArgentineanArmenianAssyrian/Chaldean/SyriacAustralianAustrianBahamianBangladeshiBarbadianBasqueBelgianBelizeanBermudanBhutaneseBlackfeetBolivianBrazilianBritishBritish West IndianBulgarianBurmeseCajunCambodianCanadianCape VerdeanCarpatho RusynCelticCentral AmericanCentral American IndianCherokeeCheyenneChickasawChileanChineseChippewaChoctawColombianColvilleComancheCosta RicanCreeCreekCroatianCrowCubanCypriotCzechCzechoslovakianDanishDelawareDominicanDutchDutch West IndianEastern EuropeanEcuadorianEgyptianEnglishEstonianEthiopianEuropeanFijianFilipinoFinnishFrenchFrench American IndianFrench CanadianGermanGerman RussianGhanaianGreekGuamanian/ChamorroGuatemalanGuyaneseHaitianHmongHonduranHopiHoumaHungarianIcelanderIndian (Asian)IndonesianInupiatIranianIraqiIrishIroquoisIsraeliItalianJamaicanJapaneseJordanianKenyanKiowaKoreanLaotianLatvianLebaneseLiberianLithuanianLumbeeLuxembourgerMacedonianMalaysianMalteseMarshalleseMenomineeMexicanMexican American IndianMongolianMoroccanNative HawaiianNavajoNepaleseNew ZealanderNicaraguanNigerianNorthern EuropeanNorwegianOkinawanOsageOttawaPaiutePakistaniPalestinianPanamanianParaguayanPennsylvania GermanPeruvianPimaPolishPortuguesePotawatomiPuebloPuerto RicanPuget Sound SalishRomanianRussianSalvadoranSamoanScandinavianScotch-IrishScottishSeminoleSenegaleseSerbianShoshoneSierra LeoneanSiouxSlavicSlovakSloveneSomaliSouth AfricanSouth AmericanSouth American IndianSoviet UnionSpaniardSpanishSpanish AmericanSpanish American IndianSri LankanSubsaharan AfricanSudaneseSwedishSwissSyrianTaiwaneseThaiTlingit-HaidaTohono O'OdhamTonganTrinidadian and TobagonianTsimshianTurkishU.S. Virgin IslanderUgandanUkrainianUruguayanUteVenezuelanVietnameseWelshWest IndianYakamaYaquiYugoslavianYumanYup'ikZimbabwean
Immigration
NonimmigrantsImmigrantsAfghanistanAfricaAlbaniaArgentinaArmeniaAsiaAustraliaAustriaBahamasBangladeshBarbadosBelarusBelgiumBelizeBoliviaBosnia and HerzegovinaBrazilBulgariaBurma/MyanmarCabo VerdeCambodiaCameroonCanadaCaribbeanCentral AmericaChileChinaColombiaCongoCosta RicaCroatiaCubaCzechoslovakiaDenmarkDominicaDominican RepublicEastern AfricaEastern AsiaEastern EuropeEcuadorEgyptEl SalvadorEnglandEritreaEthiopiaEuropeFijiFranceGermanyGhanaGreeceGrenadaGuatemalaGuyanaHaitiHondurasHong KongHungaryIndiaIndonesiaIranIraqIrelandIsraelItalyJamaicaJapanJordanKazakhstanKenyaKoreaKuwaitLaosLatin AmericaLatviaLebanonLiberiaLithuaniaMalaysiaMexicoMicronesiaMiddle AfricaMoldovaMoroccoNepalNetherlandsNicaraguaNigeriaNorth AmericaNorth MacedoniaNorthern AfricaNorthern EuropeNorwayOceaniaPakistanPanamaPeruPhilippinesPolandPortugalRomaniaRussiaSaudi ArabiaScotlandSenegalSerbiaSierra LeoneSingaporeSomaliaSouth AfricaSouth AmericaSouth Central AsiaSouth Eastern AsiaSouthern EuropeSpainSri LankaSt. Vincent and the GrenadinesSudanSwedenSwitzerlandSyriaTaiwanThailandTrinidad and TobagoTurkeyUgandaUkraineUruguayUzbekistanVenezuelaVietnamWest IndiesWestern AsiaWestern EuropeYemenZaireZimbabweAzores
Immigrants from Western Africa
Race
Ancestry
AfghanAfricanAlaska NativeAlaskan AthabascanAlbanianAleutAlsatianAmericanApacheArabArapahoArgentineanArmenianAssyrian/Chaldean/SyriacAustralianAustrianBahamianBangladeshiBarbadianBasqueBelgianBelizeanBermudanBhutaneseBlackfeetBolivianBrazilianBritishBritish West IndianBulgarianBurmeseCajunCambodianCanadianCape VerdeanCarpatho RusynCelticCentral AmericanCentral American IndianCherokeeCheyenneChickasawChileanChineseChippewaChoctawColombianColvilleComancheCosta RicanCreeCreekCroatianCrowCubanCypriotCzechCzechoslovakianDanishDelawareDominicanDutchDutch West IndianEastern EuropeanEcuadorianEgyptianEnglishEstonianEthiopianEuropeanFijianFilipinoFinnishFrenchFrench American IndianFrench CanadianGermanGerman RussianGhanaianGreekGuamanian/ChamorroGuatemalanGuyaneseHaitianHmongHonduranHopiHoumaHungarianIcelanderIndian (Asian)IndonesianInupiatIranianIraqiIrishIroquoisIsraeliItalianJamaicanJapaneseJordanianKenyanKiowaKoreanLaotianLatvianLebaneseLiberianLithuanianLumbeeLuxembourgerMacedonianMalaysianMalteseMarshalleseMenomineeMexicanMexican American IndianMongolianMoroccanNative HawaiianNavajoNepaleseNew ZealanderNicaraguanNigerianNorthern EuropeanNorwegianOkinawanOsageOttawaPaiutePakistaniPalestinianPanamanianParaguayanPennsylvania GermanPeruvianPimaPolishPortuguesePotawatomiPuebloPuerto RicanPuget Sound SalishRomanianRussianSalvadoranSamoanScandinavianScotch-IrishScottishSeminoleSenegaleseSerbianShoshoneSierra LeoneanSiouxSlavicSlovakSloveneSomaliSouth AfricanSouth AmericanSouth American IndianSoviet UnionSpaniardSpanishSpanish AmericanSpanish American IndianSri LankanSubsaharan AfricanSudaneseSwedishSwissSyrianTaiwaneseThaiTlingit-HaidaTohono O'OdhamTonganTrinidadian and TobagonianTsimshianTurkishU.S. Virgin IslanderUgandanUkrainianUruguayanUteVenezuelanVietnameseWelshWest IndianYakamaYaquiYugoslavianYumanYup'ikZimbabwean
Immigration
NonimmigrantsImmigrantsAfghanistanAfricaAlbaniaArgentinaArmeniaAsiaAustraliaAustriaBahamasBangladeshBarbadosBelarusBelgiumBelizeBoliviaBosnia and HerzegovinaBrazilBulgariaBurma/MyanmarCabo VerdeCambodiaCameroonCanadaCaribbeanCentral AmericaChileChinaColombiaCongoCosta RicaCroatiaCubaCzechoslovakiaDenmarkDominicaDominican RepublicEastern AfricaEastern AsiaEastern EuropeEcuadorEgyptEl SalvadorEnglandEritreaEthiopiaEuropeFijiFranceGermanyGhanaGreeceGrenadaGuatemalaGuyanaHaitiHondurasHong KongHungaryIndiaIranIraqIrelandIsraelItalyJamaicaJapanJordanKazakhstanKenyaKoreaKuwaitLaosLatin AmericaLatviaLebanonLiberiaLithuaniaMalaysiaMexicoMicronesiaMiddle AfricaMoldovaMoroccoNepalNetherlandsNicaraguaNigeriaNorth AmericaNorth MacedoniaNorthern AfricaNorthern EuropeNorwayOceaniaPakistanPanamaPeruPhilippinesPolandPortugalRomaniaRussiaSaudi ArabiaScotlandSenegalSerbiaSierra LeoneSingaporeSomaliaSouth AfricaSouth AmericaSouth Central AsiaSouth Eastern AsiaSouthern EuropeSpainSri LankaSt. Vincent and the GrenadinesSudanSwedenSwitzerlandSyriaTaiwanThailandTrinidad and TobagoTurkeyUgandaUkraineUruguayUzbekistanVenezuelaVietnamWest IndiesWestern AfricaWestern AsiaWestern EuropeYemenZaireZimbabweAzores
Child Poverty Under the Age of 5
Income
Poverty
Unemployment
Labor Participation
Family Structure
Vehicle Availability
Education Level
Disability

Child Poverty Under the Age of 5 Comparison

Immigrants from Indonesia

Immigrants from Western Africa

Exceptional
Tragic
14.3%
CHILD POVERTY UNDER THE AGE OF 5
99.8/ 100
METRIC RATING
28th/ 347
METRIC RANK
19.7%
CHILD POVERTY UNDER THE AGE OF 5
0.4/ 100
METRIC RATING
245th/ 347
METRIC RANK

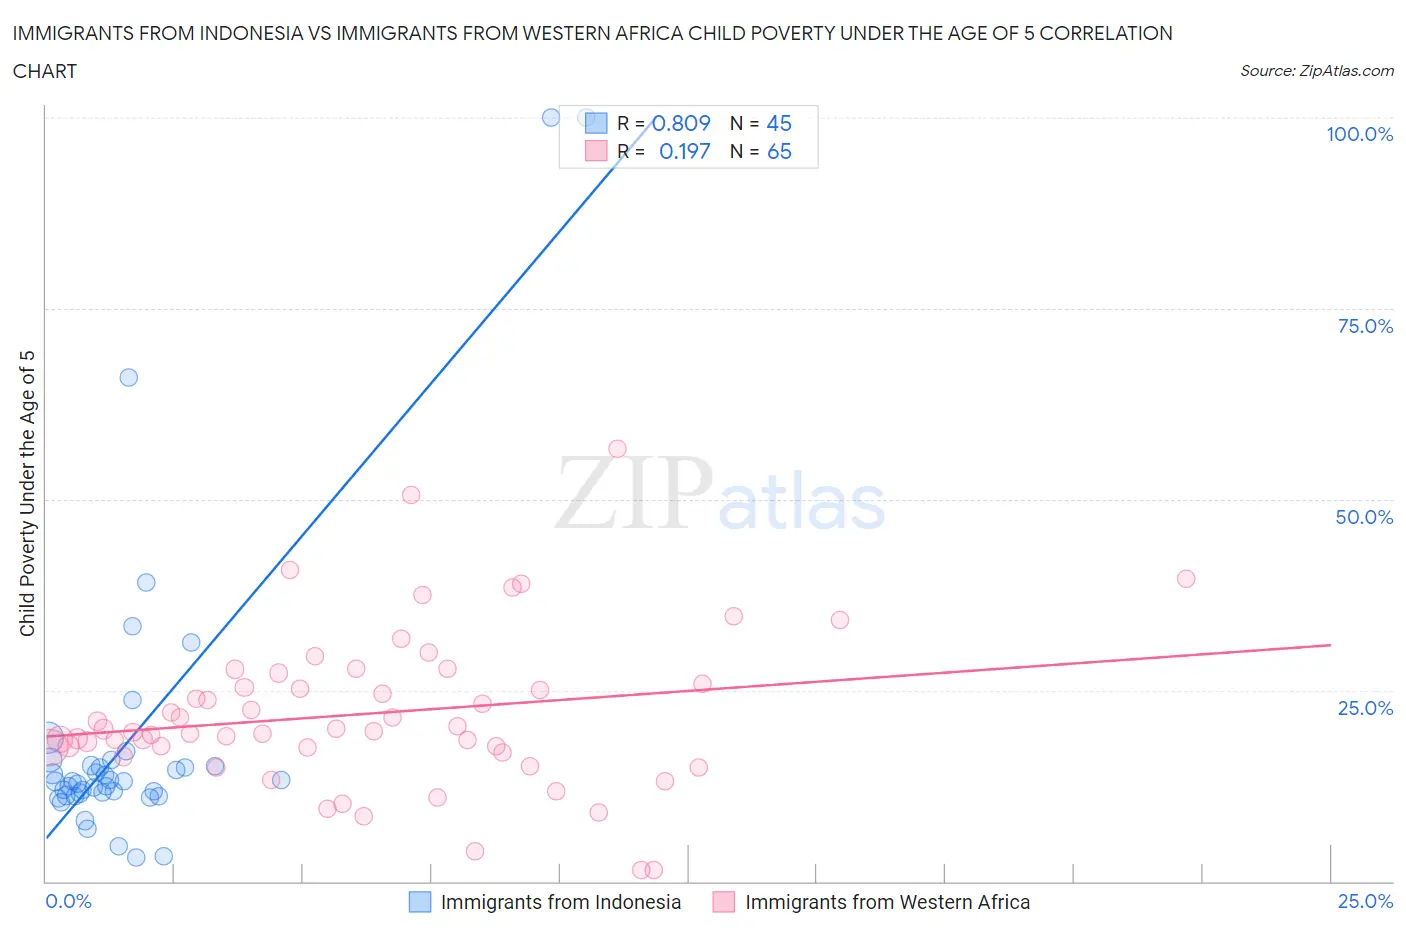
Immigrants from Indonesia vs Immigrants from Western Africa Child Poverty Under the Age of 5 Correlation Chart

The statistical analysis conducted on geographies consisting of 210,678,212 people shows a very strong positive correlation between the proportion of Immigrants from Indonesia and poverty level among children under the age of 5 in the United States with a correlation coefficient (R) of 0.809 and weighted average of 14.3%. Similarly, the statistical analysis conducted on geographies consisting of 347,415,255 people shows a poor positive correlation between the proportion of Immigrants from Western Africa and poverty level among children under the age of 5 in the United States with a correlation coefficient (R) of 0.197 and weighted average of 19.7%, a difference of 37.3%.
Immigrants from Indonesia vs Immigrants from Western Africa Child Poverty Under the Age of 5

Child Poverty Under the Age of 5 Correlation Summary

MeasurementImmigrants from IndonesiaImmigrants from Western Africa
Minimum3.0%1.5%
Maximum100.0%56.7%
Range97.0%55.2%
Mean19.0%21.9%
Median13.0%19.6%
Interquartile 25% (IQ1)11.4%17.2%
Interquartile 75% (IQ3)15.5%26.5%
Interquartile Range (IQR)4.1%9.4%
Standard Deviation (Sample)20.4%10.3%
Standard Deviation (Population)20.2%10.2%

Similar Demographics by Child Poverty Under the Age of 5

Demographics Similar to Immigrants from Indonesia by Child Poverty Under the Age of 5

In terms of child poverty under the age of 5, the demographic groups most similar to Immigrants from Indonesia are Immigrants from Asia (14.4%, a difference of 0.39%), Cambodian (14.4%, a difference of 0.44%), Korean (14.4%, a difference of 0.47%), Immigrants from Sri Lanka (14.4%, a difference of 0.75%), and Taiwanese (14.5%, a difference of 1.1%).
DemographicsRating | RankChild Poverty Under the Age of 5
Bolivians
100.0
/100
|
#21
Exceptional
13.8%
Immigrants | Bolivia
100.0
/100
|
#22
Exceptional
13.8%
Bulgarians
99.9
/100
|
#23
Exceptional
13.9%
Asians
99.9
/100
|
#24
Exceptional
14.0%
Cypriots
99.9
/100
|
#25
Exceptional
14.0%
Immigrants | Lithuania
99.9
/100
|
#26
Exceptional
14.1%
Tongans
99.9
/100
|
#27
Exceptional
14.2%
Immigrants | Indonesia
99.8
/100
|
#28
Exceptional
14.3%
Immigrants | Asia
99.8
/100
|
#29
Exceptional
14.4%
Cambodians
99.8
/100
|
#30
Exceptional
14.4%
Koreans
99.8
/100
|
#31
Exceptional
14.4%
Immigrants | Sri Lanka
99.8
/100
|
#32
Exceptional
14.4%
Taiwanese
99.8
/100
|
#33
Exceptional
14.5%
Immigrants | Moldova
99.8
/100
|
#34
Exceptional
14.5%
Latvians
99.8
/100
|
#35
Exceptional
14.5%

Demographics Similar to Immigrants from Western Africa by Child Poverty Under the Age of 5

In terms of child poverty under the age of 5, the demographic groups most similar to Immigrants from Western Africa are Cree (19.7%, a difference of 0.070%), Immigrants from Ghana (19.6%, a difference of 0.18%), Osage (19.6%, a difference of 0.21%), Guyanese (19.7%, a difference of 0.23%), and Marshallese (19.7%, a difference of 0.25%).
DemographicsRating | RankChild Poverty Under the Age of 5
Salvadorans
0.6
/100
|
#238
Tragic
19.5%
Vietnamese
0.6
/100
|
#239
Tragic
19.5%
Immigrants | Ecuador
0.5
/100
|
#240
Tragic
19.6%
Alaska Natives
0.5
/100
|
#241
Tragic
19.6%
Immigrants | Guyana
0.5
/100
|
#242
Tragic
19.6%
Osage
0.5
/100
|
#243
Tragic
19.6%
Immigrants | Ghana
0.5
/100
|
#244
Tragic
19.6%
Immigrants | Western Africa
0.4
/100
|
#245
Tragic
19.7%
Cree
0.4
/100
|
#246
Tragic
19.7%
Guyanese
0.4
/100
|
#247
Tragic
19.7%
Marshallese
0.4
/100
|
#248
Tragic
19.7%
Immigrants | Middle Africa
0.4
/100
|
#249
Tragic
19.7%
Immigrants | Nonimmigrants
0.4
/100
|
#250
Tragic
19.7%
Pennsylvania Germans
0.3
/100
|
#251
Tragic
19.8%
Immigrants | Nicaragua
0.3
/100
|
#252
Tragic
19.8%