Immigrants from Haiti vs Haitian Child Poverty Under the Age of 16
COMPARE
Immigrants from Haiti
Haitian
Child Poverty Under the Age of 16
Child Poverty Under the Age of 16 Comparison
Immigrants from Haiti
Haitians
20.9%
CHILD POVERTY UNDER THE AGE OF 16
0.0/ 100
METRIC RATING
299th/ 347
METRIC RANK
20.7%
CHILD POVERTY UNDER THE AGE OF 16
0.0/ 100
METRIC RATING
294th/ 347
METRIC RANK
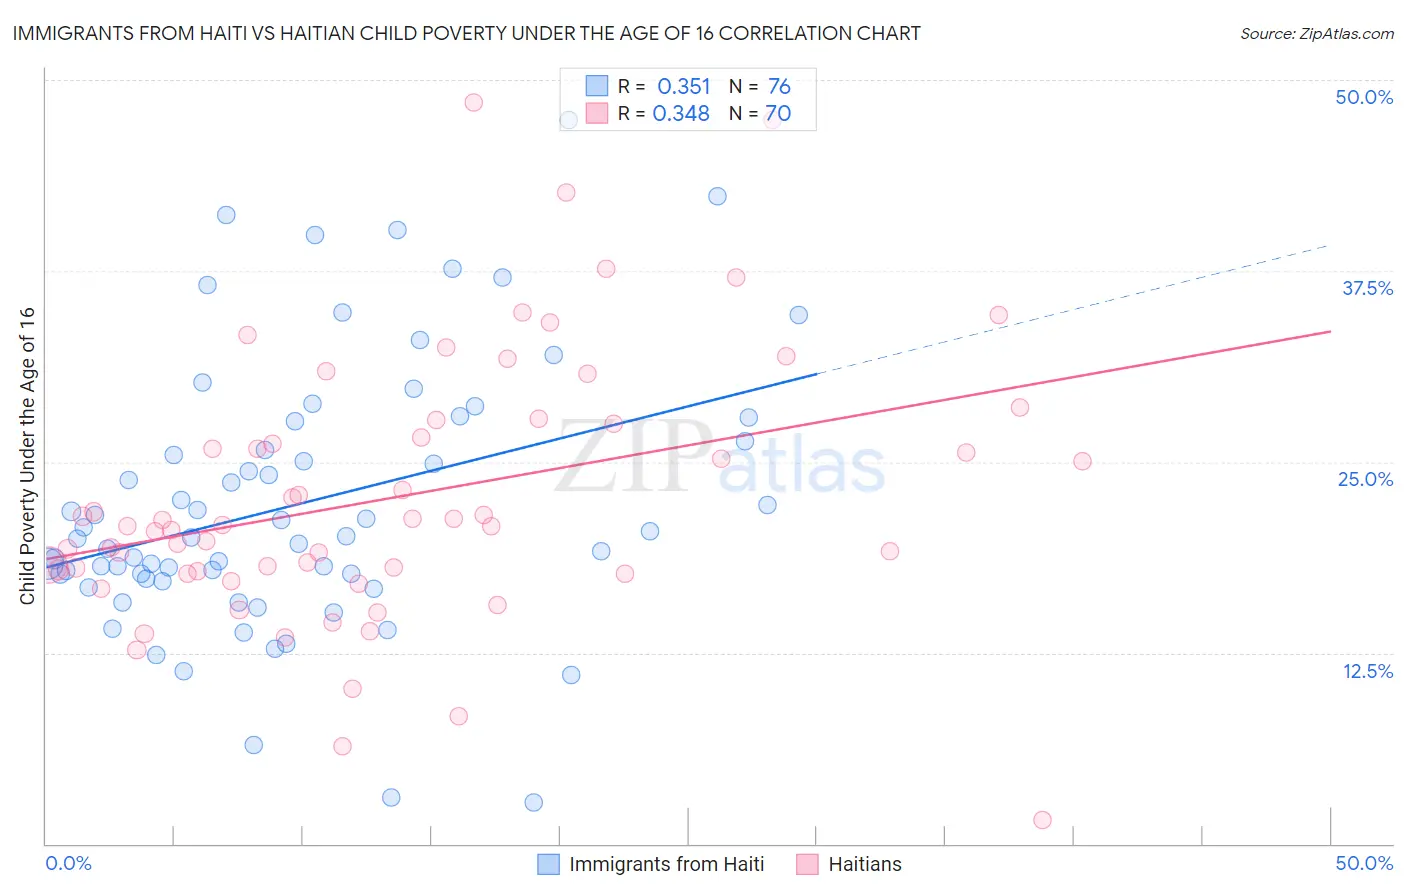
Immigrants from Haiti vs Haitian Child Poverty Under the Age of 16 Correlation Chart
The statistical analysis conducted on geographies consisting of 224,047,921 people shows a mild positive correlation between the proportion of Immigrants from Haiti and poverty level among children under the age of 16 in the United States with a correlation coefficient (R) of 0.351 and weighted average of 20.9%. Similarly, the statistical analysis conducted on geographies consisting of 286,258,952 people shows a mild positive correlation between the proportion of Haitians and poverty level among children under the age of 16 in the United States with a correlation coefficient (R) of 0.348 and weighted average of 20.7%, a difference of 0.96%.
Child Poverty Under the Age of 16 Correlation Summary
| Measurement | Immigrants from Haiti | Haitian |
| Minimum | 2.7% | 1.6% |
| Maximum | 47.4% | 48.5% |
| Range | 44.6% | 46.9% |
| Mean | 22.3% | 22.7% |
| Median | 20.1% | 20.8% |
| Interquartile 25% (IQ1) | 17.5% | 17.9% |
| Interquartile 75% (IQ3) | 27.0% | 27.5% |
| Interquartile Range (IQR) | 9.5% | 9.6% |
| Standard Deviation (Sample) | 8.8% | 8.7% |
| Standard Deviation (Population) | 8.8% | 8.7% |
Demographics Similar to Immigrants from Haiti and Haitians by Child Poverty Under the Age of 16
In terms of child poverty under the age of 16, the demographic groups most similar to Immigrants from Haiti are Arapaho (20.8%, a difference of 0.30%), Hispanic or Latino (20.8%, a difference of 0.31%), Immigrants from Caribbean (20.8%, a difference of 0.43%), Indonesian (21.0%, a difference of 0.49%), and Immigrants from Grenada (21.0%, a difference of 0.54%). Similarly, the demographic groups most similar to Haitians are Mexican (20.7%, a difference of 0.14%), Immigrants from Senegal (20.6%, a difference of 0.21%), Immigrants from Caribbean (20.8%, a difference of 0.52%), Immigrants from Latin America (20.5%, a difference of 0.64%), and Hispanic or Latino (20.8%, a difference of 0.65%).
| Demographics | Rating | Rank | Child Poverty Under the Age of 16 |
| Immigrants | West Indies | 0.0 /100 | #286 | Tragic 20.2% |
| Blackfeet | 0.0 /100 | #287 | Tragic 20.2% |
| Immigrants | Belize | 0.0 /100 | #288 | Tragic 20.3% |
| Senegalese | 0.0 /100 | #289 | Tragic 20.4% |
| Yaqui | 0.0 /100 | #290 | Tragic 20.4% |
| Chippewa | 0.0 /100 | #291 | Tragic 20.5% |
| Immigrants | Latin America | 0.0 /100 | #292 | Tragic 20.5% |
| Immigrants | Senegal | 0.0 /100 | #293 | Tragic 20.6% |
| Haitians | 0.0 /100 | #294 | Tragic 20.7% |
| Mexicans | 0.0 /100 | #295 | Tragic 20.7% |
| Immigrants | Caribbean | 0.0 /100 | #296 | Tragic 20.8% |
| Hispanics or Latinos | 0.0 /100 | #297 | Tragic 20.8% |
| Arapaho | 0.0 /100 | #298 | Tragic 20.8% |
| Immigrants | Haiti | 0.0 /100 | #299 | Tragic 20.9% |
| Indonesians | 0.0 /100 | #300 | Tragic 21.0% |
| Immigrants | Grenada | 0.0 /100 | #301 | Tragic 21.0% |
| Immigrants | Bahamas | 0.0 /100 | #302 | Tragic 21.0% |
| Choctaw | 0.0 /100 | #303 | Tragic 21.0% |
| Somalis | 0.0 /100 | #304 | Tragic 21.0% |
| Seminole | 0.0 /100 | #305 | Tragic 21.1% |
| Guatemalans | 0.0 /100 | #306 | Tragic 21.2% |