Immigrants from Grenada vs Irish Female Poverty Among 25-34 Year Olds
COMPARE
Immigrants from Grenada
Irish
Female Poverty Among 25-34 Year Olds
Female Poverty Among 25-34 Year Olds Comparison
Immigrants from Grenada
Irish
14.7%
FEMALE POVERTY AMONG 25-34 YEAR OLDS
1.3/ 100
METRIC RATING
240th/ 347
METRIC RANK
13.7%
FEMALE POVERTY AMONG 25-34 YEAR OLDS
35.3/ 100
METRIC RATING
185th/ 347
METRIC RANK
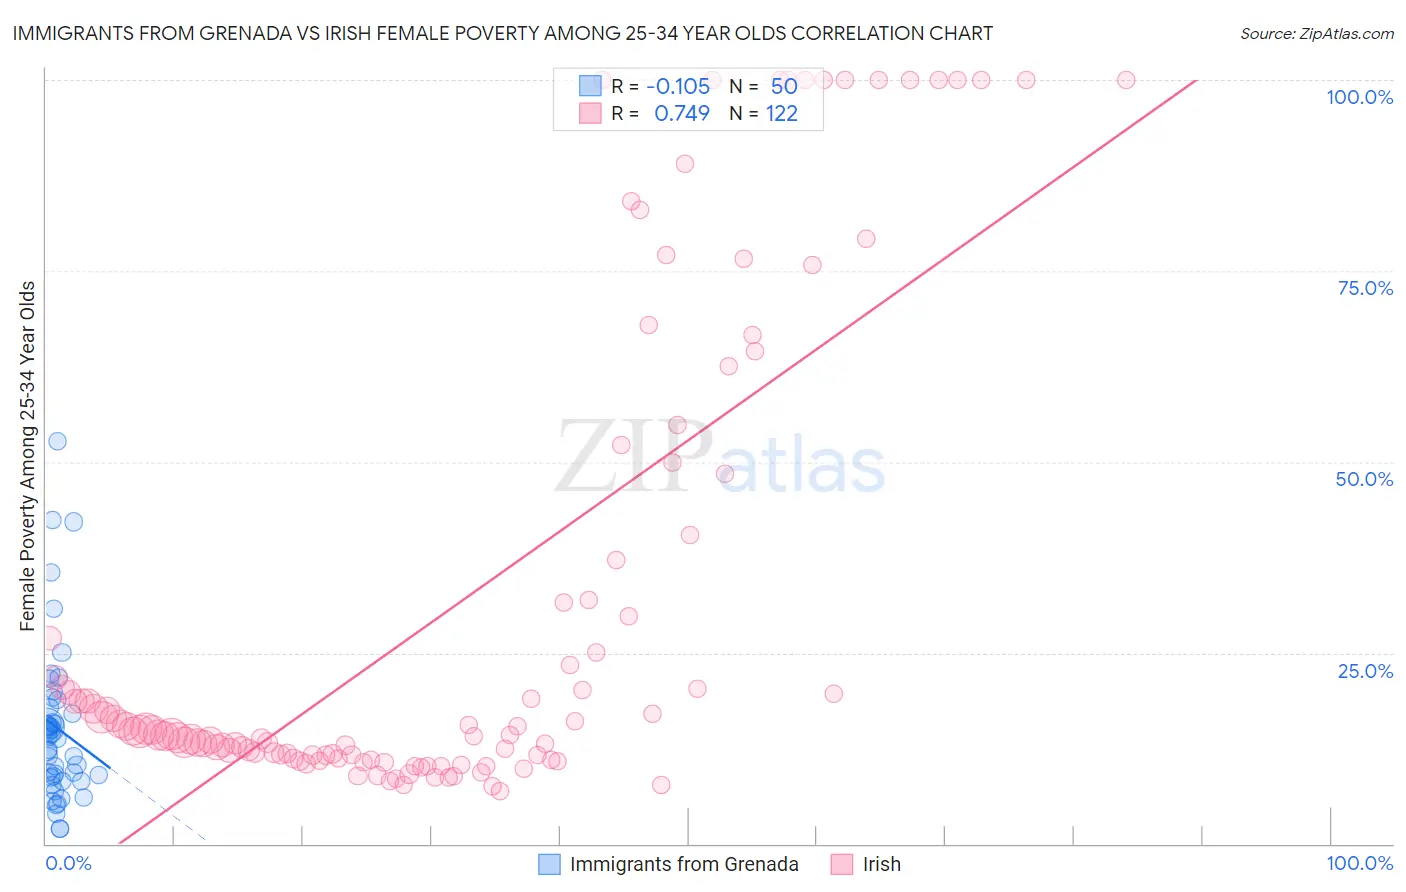
Immigrants from Grenada vs Irish Female Poverty Among 25-34 Year Olds Correlation Chart
The statistical analysis conducted on geographies consisting of 67,009,327 people shows a poor negative correlation between the proportion of Immigrants from Grenada and poverty level among females between the ages 25 and 34 in the United States with a correlation coefficient (R) of -0.105 and weighted average of 14.7%. Similarly, the statistical analysis conducted on geographies consisting of 555,342,984 people shows a strong positive correlation between the proportion of Irish and poverty level among females between the ages 25 and 34 in the United States with a correlation coefficient (R) of 0.749 and weighted average of 13.7%, a difference of 7.6%.
Female Poverty Among 25-34 Year Olds Correlation Summary
| Measurement | Immigrants from Grenada | Irish |
| Minimum | 1.9% | 6.8% |
| Maximum | 52.7% | 100.0% |
| Range | 50.8% | 93.2% |
| Mean | 15.1% | 31.0% |
| Median | 13.8% | 14.6% |
| Interquartile 25% (IQ1) | 8.6% | 11.5% |
| Interquartile 75% (IQ3) | 17.9% | 37.1% |
| Interquartile Range (IQR) | 9.3% | 25.6% |
| Standard Deviation (Sample) | 10.4% | 31.4% |
| Standard Deviation (Population) | 10.3% | 31.3% |
Similar Demographics by Female Poverty Among 25-34 Year Olds
Demographics Similar to Immigrants from Grenada by Female Poverty Among 25-34 Year Olds
In terms of female poverty among 25-34 year olds, the demographic groups most similar to Immigrants from Grenada are Malaysian (14.7%, a difference of 0.050%), Alsatian (14.7%, a difference of 0.080%), Salvadoran (14.7%, a difference of 0.12%), Immigrants from Ghana (14.7%, a difference of 0.12%), and Immigrants from Jamaica (14.7%, a difference of 0.14%).
| Demographics | Rating | Rank | Female Poverty Among 25-34 Year Olds |
| Whites/Caucasians | 1.8 /100 | #233 | Tragic 14.7% |
| Cubans | 1.6 /100 | #234 | Tragic 14.7% |
| Immigrants | Jamaica | 1.4 /100 | #235 | Tragic 14.7% |
| Salvadorans | 1.4 /100 | #236 | Tragic 14.7% |
| Immigrants | Ghana | 1.4 /100 | #237 | Tragic 14.7% |
| Alsatians | 1.4 /100 | #238 | Tragic 14.7% |
| Malaysians | 1.4 /100 | #239 | Tragic 14.7% |
| Immigrants | Grenada | 1.3 /100 | #240 | Tragic 14.7% |
| Scotch-Irish | 1.2 /100 | #241 | Tragic 14.8% |
| Barbadians | 1.2 /100 | #242 | Tragic 14.8% |
| Immigrants | Nicaragua | 1.1 /100 | #243 | Tragic 14.8% |
| Immigrants | Bangladesh | 1.1 /100 | #244 | Tragic 14.8% |
| Immigrants | Middle Africa | 1.0 /100 | #245 | Tragic 14.8% |
| Jamaicans | 1.0 /100 | #246 | Tragic 14.8% |
| German Russians | 0.8 /100 | #247 | Tragic 14.9% |
Demographics Similar to Irish by Female Poverty Among 25-34 Year Olds
In terms of female poverty among 25-34 year olds, the demographic groups most similar to Irish are Immigrants from Uruguay (13.7%, a difference of 0.11%), Slovak (13.7%, a difference of 0.11%), Czechoslovakian (13.7%, a difference of 0.13%), Immigrants from Eritrea (13.7%, a difference of 0.24%), and Finnish (13.7%, a difference of 0.26%).
| Demographics | Rating | Rank | Female Poverty Among 25-34 Year Olds |
| Canadians | 44.3 /100 | #178 | Average 13.6% |
| Immigrants | Eastern Africa | 43.6 /100 | #179 | Average 13.6% |
| Germans | 41.6 /100 | #180 | Average 13.6% |
| Guamanians/Chamorros | 41.5 /100 | #181 | Average 13.6% |
| Immigrants | Venezuela | 40.7 /100 | #182 | Average 13.6% |
| Portuguese | 40.3 /100 | #183 | Average 13.6% |
| Czechoslovakians | 36.8 /100 | #184 | Fair 13.7% |
| Irish | 35.3 /100 | #185 | Fair 13.7% |
| Immigrants | Uruguay | 34.1 /100 | #186 | Fair 13.7% |
| Slovaks | 34.1 /100 | #187 | Fair 13.7% |
| Immigrants | Eritrea | 32.7 /100 | #188 | Fair 13.7% |
| Finns | 32.5 /100 | #189 | Fair 13.7% |
| Dutch | 29.7 /100 | #190 | Fair 13.8% |
| Immigrants | St. Vincent and the Grenadines | 29.3 /100 | #191 | Fair 13.8% |
| Tlingit-Haida | 28.1 /100 | #192 | Fair 13.8% |