Immigrants from Greece vs Immigrants from Cabo Verde Child Poverty Among Boys Under 16
COMPARE
Immigrants from Greece
Immigrants from Cabo Verde
Child Poverty Among Boys Under 16
Child Poverty Among Boys Under 16 Comparison
Immigrants from Greece
Immigrants from Cabo Verde
14.2%
CHILD POVERTY AMONG BOYS UNDER 16
99.2/ 100
METRIC RATING
51st/ 347
METRIC RANK
19.7%
CHILD POVERTY AMONG BOYS UNDER 16
0.1/ 100
METRIC RATING
269th/ 347
METRIC RANK
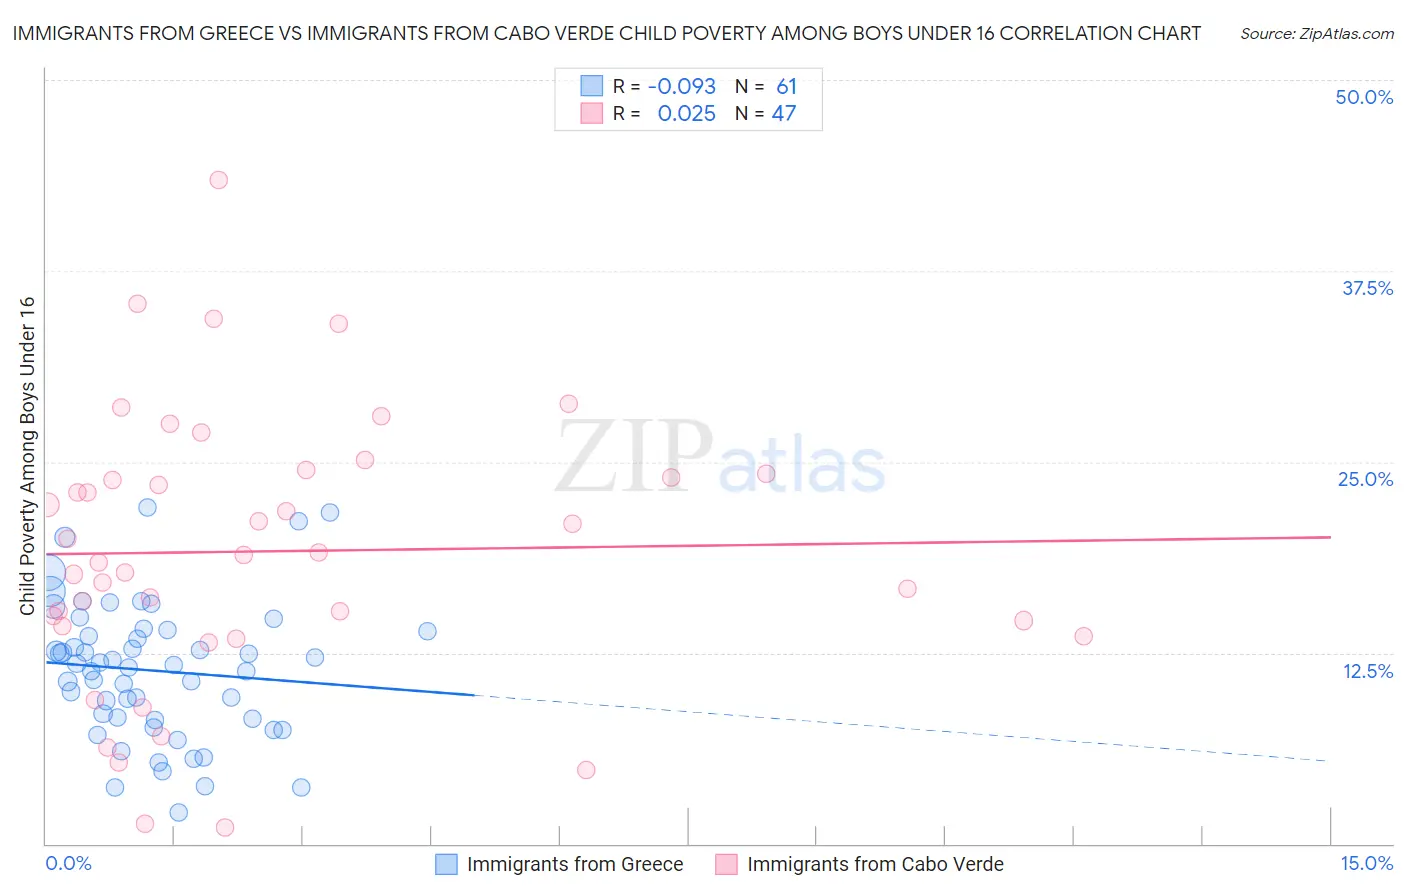
Immigrants from Greece vs Immigrants from Cabo Verde Child Poverty Among Boys Under 16 Correlation Chart
The statistical analysis conducted on geographies consisting of 213,501,613 people shows a slight negative correlation between the proportion of Immigrants from Greece and poverty level among boys under the age of 16 in the United States with a correlation coefficient (R) of -0.093 and weighted average of 14.2%. Similarly, the statistical analysis conducted on geographies consisting of 37,877,952 people shows no correlation between the proportion of Immigrants from Cabo Verde and poverty level among boys under the age of 16 in the United States with a correlation coefficient (R) of 0.025 and weighted average of 19.7%, a difference of 38.2%.
Child Poverty Among Boys Under 16 Correlation Summary
| Measurement | Immigrants from Greece | Immigrants from Cabo Verde |
| Minimum | 2.0% | 1.0% |
| Maximum | 22.0% | 43.4% |
| Range | 20.0% | 42.4% |
| Mean | 11.3% | 19.1% |
| Median | 11.7% | 18.9% |
| Interquartile 25% (IQ1) | 8.1% | 14.2% |
| Interquartile 75% (IQ3) | 13.9% | 24.2% |
| Interquartile Range (IQR) | 5.8% | 10.0% |
| Standard Deviation (Sample) | 4.5% | 8.9% |
| Standard Deviation (Population) | 4.4% | 8.8% |
Similar Demographics by Child Poverty Among Boys Under 16
Demographics Similar to Immigrants from Greece by Child Poverty Among Boys Under 16
In terms of child poverty among boys under 16, the demographic groups most similar to Immigrants from Greece are Italian (14.2%, a difference of 0.13%), Czech (14.1%, a difference of 0.62%), Laotian (14.3%, a difference of 0.69%), Immigrants from Indonesia (14.1%, a difference of 0.71%), and Immigrants from Moldova (14.1%, a difference of 0.73%).
| Demographics | Rating | Rank | Child Poverty Among Boys Under 16 |
| Estonians | 99.4 /100 | #44 | Exceptional 14.1% |
| Immigrants | Scotland | 99.4 /100 | #45 | Exceptional 14.1% |
| Greeks | 99.4 /100 | #46 | Exceptional 14.1% |
| Immigrants | Moldova | 99.4 /100 | #47 | Exceptional 14.1% |
| Immigrants | Indonesia | 99.4 /100 | #48 | Exceptional 14.1% |
| Czechs | 99.3 /100 | #49 | Exceptional 14.1% |
| Italians | 99.2 /100 | #50 | Exceptional 14.2% |
| Immigrants | Greece | 99.2 /100 | #51 | Exceptional 14.2% |
| Laotians | 99.0 /100 | #52 | Exceptional 14.3% |
| Immigrants | Philippines | 99.0 /100 | #53 | Exceptional 14.3% |
| Immigrants | Serbia | 99.0 /100 | #54 | Exceptional 14.3% |
| Immigrants | Pakistan | 99.0 /100 | #55 | Exceptional 14.3% |
| Zimbabweans | 99.0 /100 | #56 | Exceptional 14.3% |
| Poles | 98.9 /100 | #57 | Exceptional 14.4% |
| Immigrants | Sweden | 98.9 /100 | #58 | Exceptional 14.4% |
Demographics Similar to Immigrants from Cabo Verde by Child Poverty Among Boys Under 16
In terms of child poverty among boys under 16, the demographic groups most similar to Immigrants from Cabo Verde are Spanish American Indian (19.6%, a difference of 0.16%), Vietnamese (19.6%, a difference of 0.27%), Cherokee (19.7%, a difference of 0.28%), Immigrants from El Salvador (19.6%, a difference of 0.29%), and Guyanese (19.6%, a difference of 0.33%).
| Demographics | Rating | Rank | Child Poverty Among Boys Under 16 |
| Immigrants | Guyana | 0.1 /100 | #262 | Tragic 19.5% |
| Ottawa | 0.1 /100 | #263 | Tragic 19.5% |
| Iroquois | 0.1 /100 | #264 | Tragic 19.6% |
| Guyanese | 0.1 /100 | #265 | Tragic 19.6% |
| Immigrants | El Salvador | 0.1 /100 | #266 | Tragic 19.6% |
| Vietnamese | 0.1 /100 | #267 | Tragic 19.6% |
| Spanish American Indians | 0.1 /100 | #268 | Tragic 19.6% |
| Immigrants | Cabo Verde | 0.1 /100 | #269 | Tragic 19.7% |
| Cherokee | 0.1 /100 | #270 | Tragic 19.7% |
| Chickasaw | 0.1 /100 | #271 | Tragic 19.8% |
| Immigrants | Ecuador | 0.1 /100 | #272 | Tragic 19.8% |
| Belizeans | 0.1 /100 | #273 | Tragic 19.9% |
| Immigrants | Bangladesh | 0.0 /100 | #274 | Tragic 19.9% |
| Jamaicans | 0.0 /100 | #275 | Tragic 20.0% |
| Sub-Saharan Africans | 0.0 /100 | #276 | Tragic 20.0% |