Immigrants from Germany vs Turkish Female Poverty Among 25-34 Year Olds
COMPARE
Immigrants from Germany
Turkish
Female Poverty Among 25-34 Year Olds
Female Poverty Among 25-34 Year Olds Comparison
Immigrants from Germany
Turks
13.9%
FEMALE POVERTY AMONG 25-34 YEAR OLDS
20.9/ 100
METRIC RATING
198th/ 347
METRIC RANK
11.4%
FEMALE POVERTY AMONG 25-34 YEAR OLDS
100.0/ 100
METRIC RATING
21st/ 347
METRIC RANK
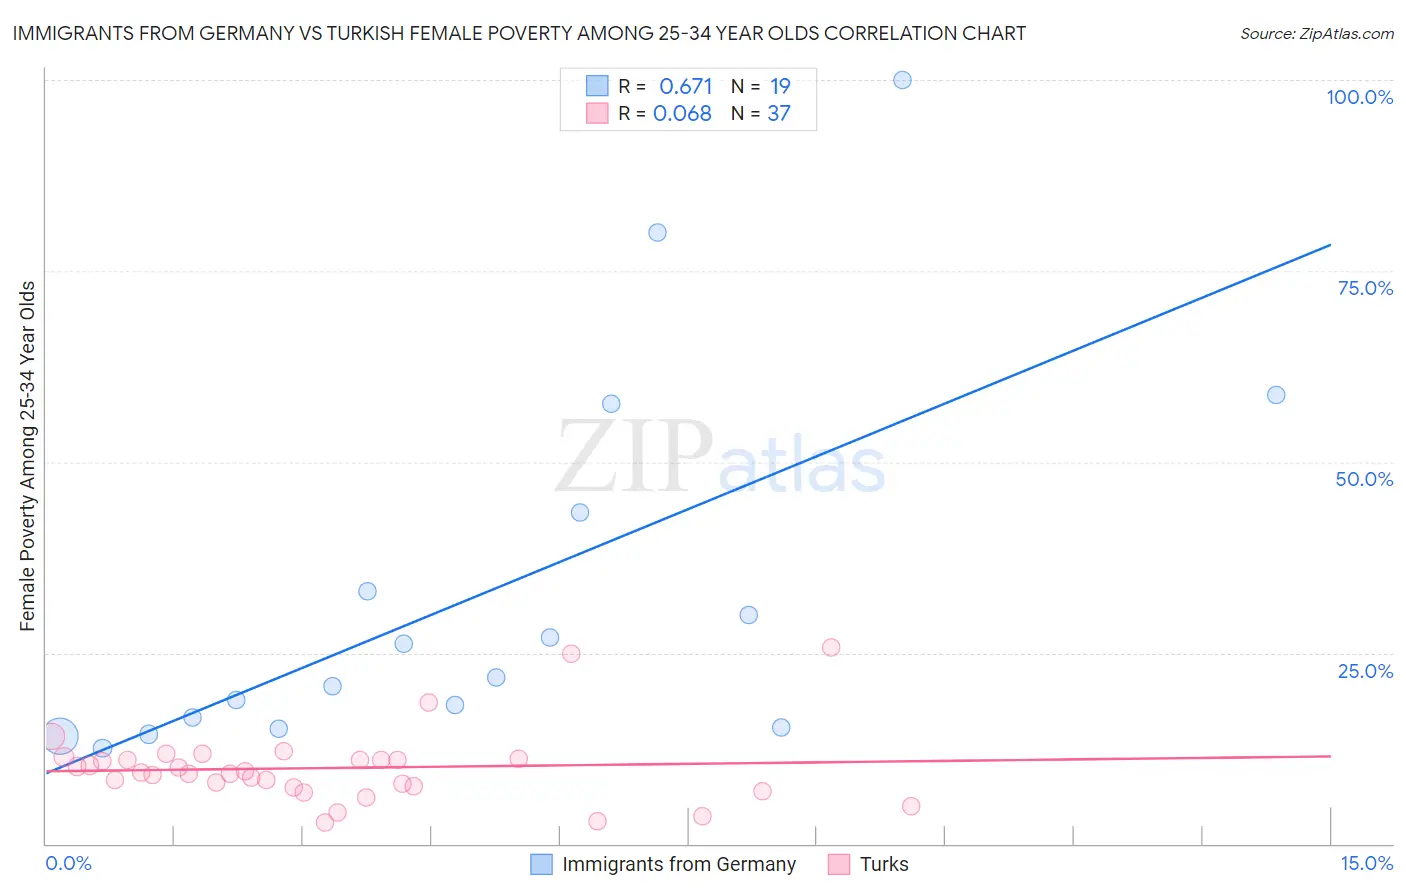
Immigrants from Germany vs Turkish Female Poverty Among 25-34 Year Olds Correlation Chart
The statistical analysis conducted on geographies consisting of 453,575,395 people shows a significant positive correlation between the proportion of Immigrants from Germany and poverty level among females between the ages 25 and 34 in the United States with a correlation coefficient (R) of 0.671 and weighted average of 13.9%. Similarly, the statistical analysis conducted on geographies consisting of 268,457,776 people shows a slight positive correlation between the proportion of Turks and poverty level among females between the ages 25 and 34 in the United States with a correlation coefficient (R) of 0.068 and weighted average of 11.4%, a difference of 22.0%.
Female Poverty Among 25-34 Year Olds Correlation Summary
| Measurement | Immigrants from Germany | Turkish |
| Minimum | 12.5% | 2.8% |
| Maximum | 100.0% | 25.6% |
| Range | 87.5% | 22.8% |
| Mean | 32.8% | 9.9% |
| Median | 21.7% | 9.3% |
| Interquartile 25% (IQ1) | 15.2% | 7.5% |
| Interquartile 75% (IQ3) | 43.3% | 11.1% |
| Interquartile Range (IQR) | 28.1% | 3.6% |
| Standard Deviation (Sample) | 24.6% | 4.8% |
| Standard Deviation (Population) | 24.0% | 4.8% |
Similar Demographics by Female Poverty Among 25-34 Year Olds
Demographics Similar to Immigrants from Germany by Female Poverty Among 25-34 Year Olds
In terms of female poverty among 25-34 year olds, the demographic groups most similar to Immigrants from Germany are English (13.9%, a difference of 0.060%), Hmong (13.9%, a difference of 0.080%), Immigrants from Saudi Arabia (13.9%, a difference of 0.11%), Scottish (13.9%, a difference of 0.32%), and Immigrants from Cambodia (13.9%, a difference of 0.36%).
| Demographics | Rating | Rank | Female Poverty Among 25-34 Year Olds |
| Immigrants | St. Vincent and the Grenadines | 29.3 /100 | #191 | Fair 13.8% |
| Tlingit-Haida | 28.1 /100 | #192 | Fair 13.8% |
| Immigrants | Kenya | 28.0 /100 | #193 | Fair 13.8% |
| Moroccans | 25.1 /100 | #194 | Fair 13.8% |
| Immigrants | Cambodia | 24.0 /100 | #195 | Fair 13.9% |
| Scottish | 23.6 /100 | #196 | Fair 13.9% |
| Immigrants | Saudi Arabia | 21.9 /100 | #197 | Fair 13.9% |
| Immigrants | Germany | 20.9 /100 | #198 | Fair 13.9% |
| English | 20.4 /100 | #199 | Fair 13.9% |
| Hmong | 20.3 /100 | #200 | Fair 13.9% |
| Immigrants | Trinidad and Tobago | 17.6 /100 | #201 | Poor 14.0% |
| Welsh | 17.2 /100 | #202 | Poor 14.0% |
| Immigrants | Immigrants | 14.5 /100 | #203 | Poor 14.0% |
| Hawaiians | 13.6 /100 | #204 | Poor 14.1% |
| Immigrants | Africa | 13.4 /100 | #205 | Poor 14.1% |
Demographics Similar to Turks by Female Poverty Among 25-34 Year Olds
In terms of female poverty among 25-34 year olds, the demographic groups most similar to Turks are Asian (11.4%, a difference of 0.15%), Bolivian (11.4%, a difference of 0.21%), Maltese (11.4%, a difference of 0.24%), Bhutanese (11.4%, a difference of 0.46%), and Tongan (11.5%, a difference of 0.61%).
| Demographics | Rating | Rank | Female Poverty Among 25-34 Year Olds |
| Indians (Asian) | 100.0 /100 | #14 | Exceptional 11.2% |
| Assyrians/Chaldeans/Syriacs | 100.0 /100 | #15 | Exceptional 11.2% |
| Immigrants | Bolivia | 100.0 /100 | #16 | Exceptional 11.2% |
| Immigrants | China | 100.0 /100 | #17 | Exceptional 11.2% |
| Immigrants | Eastern Asia | 100.0 /100 | #18 | Exceptional 11.2% |
| Iranians | 100.0 /100 | #19 | Exceptional 11.2% |
| Okinawans | 100.0 /100 | #20 | Exceptional 11.3% |
| Turks | 100.0 /100 | #21 | Exceptional 11.4% |
| Asians | 99.9 /100 | #22 | Exceptional 11.4% |
| Bolivians | 99.9 /100 | #23 | Exceptional 11.4% |
| Maltese | 99.9 /100 | #24 | Exceptional 11.4% |
| Bhutanese | 99.9 /100 | #25 | Exceptional 11.4% |
| Tongans | 99.9 /100 | #26 | Exceptional 11.5% |
| Immigrants | Greece | 99.9 /100 | #27 | Exceptional 11.5% |
| Immigrants | Pakistan | 99.9 /100 | #28 | Exceptional 11.5% |