Immigrants from Fiji vs Immigrants from Saudi Arabia Female Poverty Among 25-34 Year Olds
COMPARE
Immigrants from Fiji
Immigrants from Saudi Arabia
Female Poverty Among 25-34 Year Olds
Female Poverty Among 25-34 Year Olds Comparison
Immigrants from Fiji
Immigrants from Saudi Arabia
12.9%
FEMALE POVERTY AMONG 25-34 YEAR OLDS
91.2/ 100
METRIC RATING
126th/ 347
METRIC RANK
13.9%
FEMALE POVERTY AMONG 25-34 YEAR OLDS
21.9/ 100
METRIC RATING
197th/ 347
METRIC RANK
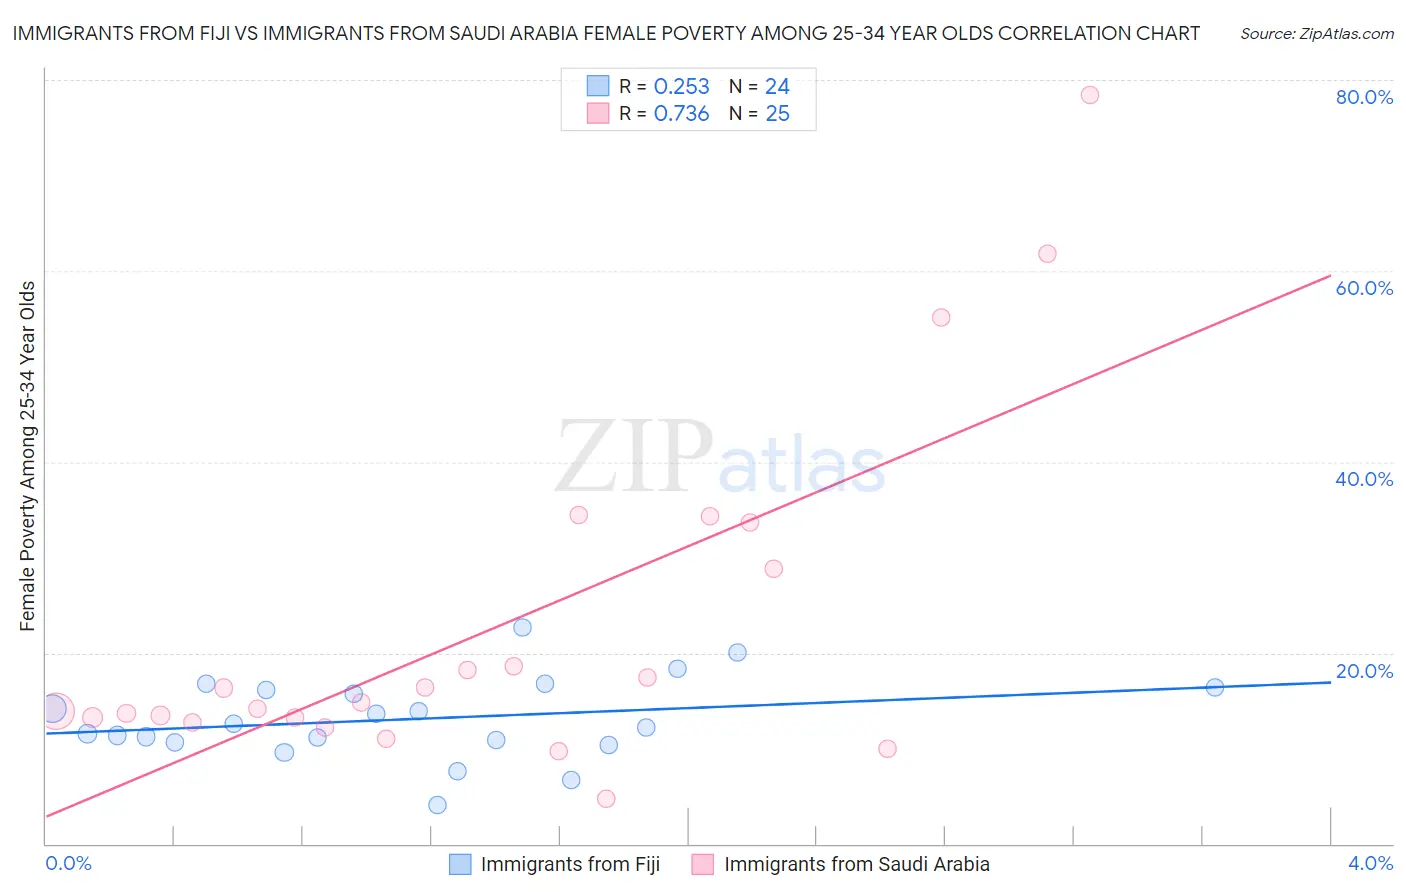
Immigrants from Fiji vs Immigrants from Saudi Arabia Female Poverty Among 25-34 Year Olds Correlation Chart
The statistical analysis conducted on geographies consisting of 93,480,984 people shows a weak positive correlation between the proportion of Immigrants from Fiji and poverty level among females between the ages 25 and 34 in the United States with a correlation coefficient (R) of 0.253 and weighted average of 12.9%. Similarly, the statistical analysis conducted on geographies consisting of 163,611,416 people shows a strong positive correlation between the proportion of Immigrants from Saudi Arabia and poverty level among females between the ages 25 and 34 in the United States with a correlation coefficient (R) of 0.736 and weighted average of 13.9%, a difference of 7.9%.
Female Poverty Among 25-34 Year Olds Correlation Summary
| Measurement | Immigrants from Fiji | Immigrants from Saudi Arabia |
| Minimum | 4.1% | 4.7% |
| Maximum | 22.6% | 78.4% |
| Range | 18.5% | 73.6% |
| Mean | 13.1% | 22.8% |
| Median | 12.4% | 14.8% |
| Interquartile 25% (IQ1) | 10.7% | 13.0% |
| Interquartile 75% (IQ3) | 16.2% | 31.3% |
| Interquartile Range (IQR) | 5.5% | 18.3% |
| Standard Deviation (Sample) | 4.3% | 18.1% |
| Standard Deviation (Population) | 4.2% | 17.7% |
Similar Demographics by Female Poverty Among 25-34 Year Olds
Demographics Similar to Immigrants from Fiji by Female Poverty Among 25-34 Year Olds
In terms of female poverty among 25-34 year olds, the demographic groups most similar to Immigrants from Fiji are Immigrants from Canada (12.9%, a difference of 0.080%), Immigrants from Netherlands (12.8%, a difference of 0.23%), Czech (12.9%, a difference of 0.23%), Syrian (12.9%, a difference of 0.25%), and Immigrants from North America (12.9%, a difference of 0.36%).
| Demographics | Rating | Rank | Female Poverty Among 25-34 Year Olds |
| Immigrants | Nepal | 93.0 /100 | #119 | Exceptional 12.8% |
| Carpatho Rusyns | 93.0 /100 | #120 | Exceptional 12.8% |
| Romanians | 92.8 /100 | #121 | Exceptional 12.8% |
| Immigrants | Western Asia | 92.7 /100 | #122 | Exceptional 12.8% |
| Slovenes | 92.7 /100 | #123 | Exceptional 12.8% |
| Immigrants | Netherlands | 92.0 /100 | #124 | Exceptional 12.8% |
| Immigrants | Canada | 91.5 /100 | #125 | Exceptional 12.9% |
| Immigrants | Fiji | 91.2 /100 | #126 | Exceptional 12.9% |
| Czechs | 90.3 /100 | #127 | Exceptional 12.9% |
| Syrians | 90.2 /100 | #128 | Exceptional 12.9% |
| Immigrants | North America | 89.7 /100 | #129 | Excellent 12.9% |
| Immigrants | Uzbekistan | 89.6 /100 | #130 | Excellent 12.9% |
| Pakistanis | 88.4 /100 | #131 | Excellent 13.0% |
| Immigrants | Hungary | 88.3 /100 | #132 | Excellent 13.0% |
| Serbians | 87.6 /100 | #133 | Excellent 13.0% |
Demographics Similar to Immigrants from Saudi Arabia by Female Poverty Among 25-34 Year Olds
In terms of female poverty among 25-34 year olds, the demographic groups most similar to Immigrants from Saudi Arabia are Immigrants from Germany (13.9%, a difference of 0.11%), English (13.9%, a difference of 0.18%), Hmong (13.9%, a difference of 0.19%), Scottish (13.9%, a difference of 0.20%), and Immigrants from Cambodia (13.9%, a difference of 0.25%).
| Demographics | Rating | Rank | Female Poverty Among 25-34 Year Olds |
| Dutch | 29.7 /100 | #190 | Fair 13.8% |
| Immigrants | St. Vincent and the Grenadines | 29.3 /100 | #191 | Fair 13.8% |
| Tlingit-Haida | 28.1 /100 | #192 | Fair 13.8% |
| Immigrants | Kenya | 28.0 /100 | #193 | Fair 13.8% |
| Moroccans | 25.1 /100 | #194 | Fair 13.8% |
| Immigrants | Cambodia | 24.0 /100 | #195 | Fair 13.9% |
| Scottish | 23.6 /100 | #196 | Fair 13.9% |
| Immigrants | Saudi Arabia | 21.9 /100 | #197 | Fair 13.9% |
| Immigrants | Germany | 20.9 /100 | #198 | Fair 13.9% |
| English | 20.4 /100 | #199 | Fair 13.9% |
| Hmong | 20.3 /100 | #200 | Fair 13.9% |
| Immigrants | Trinidad and Tobago | 17.6 /100 | #201 | Poor 14.0% |
| Welsh | 17.2 /100 | #202 | Poor 14.0% |
| Immigrants | Immigrants | 14.5 /100 | #203 | Poor 14.0% |
| Hawaiians | 13.6 /100 | #204 | Poor 14.1% |