Immigrants from El Salvador vs Spanish American Receiving Food Stamps
COMPARE
Immigrants from El Salvador
Spanish American
Receiving Food Stamps
Receiving Food Stamps Comparison
Immigrants from El Salvador
Spanish Americans
13.5%
RECEIVING FOOD STAMPS
1.5/ 100
METRIC RATING
237th/ 347
METRIC RANK
14.0%
RECEIVING FOOD STAMPS
0.4/ 100
METRIC RATING
253rd/ 347
METRIC RANK
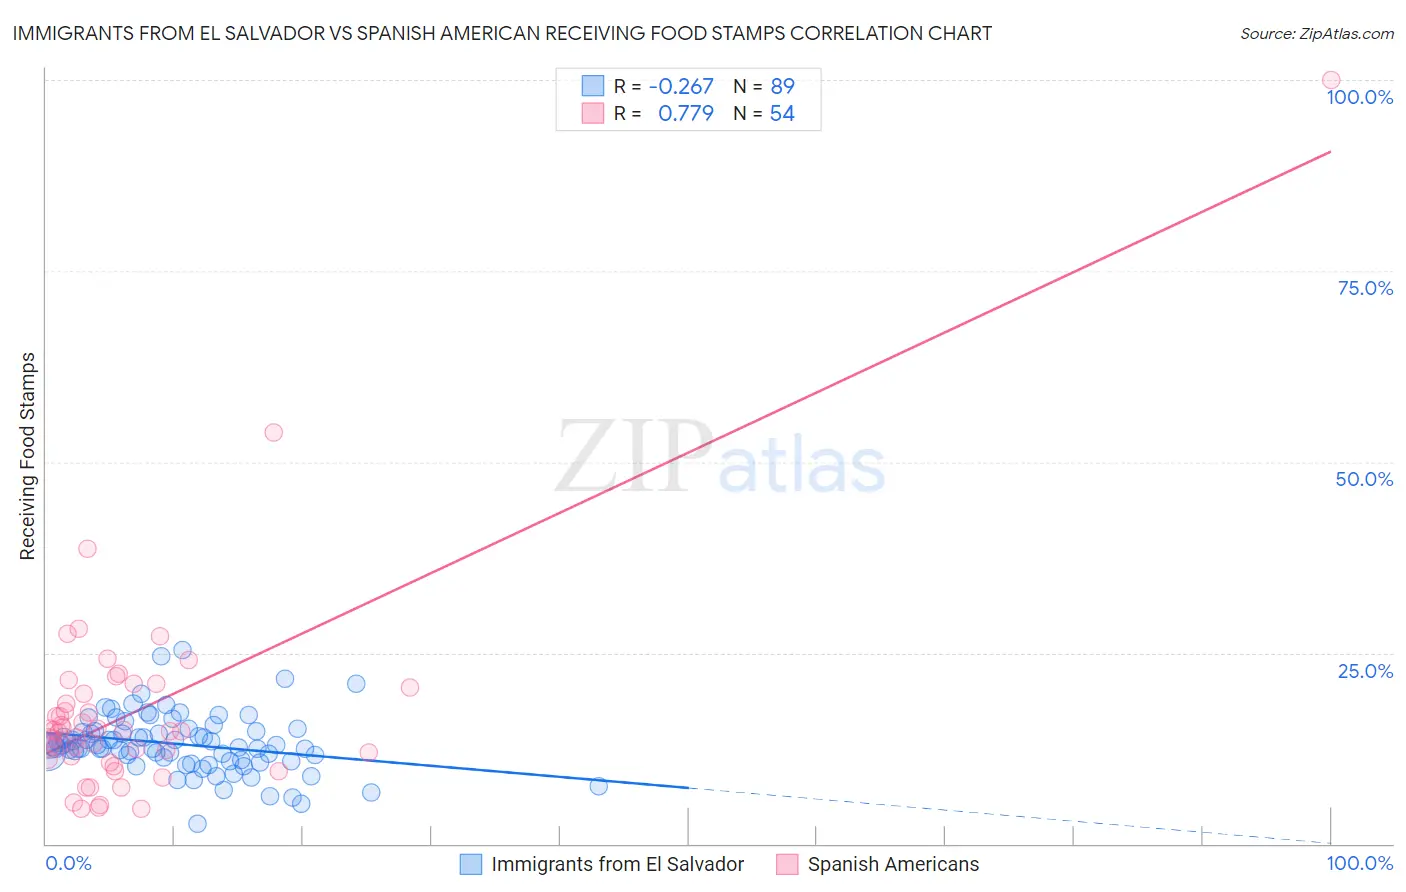
Immigrants from El Salvador vs Spanish American Receiving Food Stamps Correlation Chart
The statistical analysis conducted on geographies consisting of 357,240,396 people shows a weak negative correlation between the proportion of Immigrants from El Salvador and percentage of population receiving government assistance and/or food stamps in the United States with a correlation coefficient (R) of -0.267 and weighted average of 13.5%. Similarly, the statistical analysis conducted on geographies consisting of 103,122,620 people shows a strong positive correlation between the proportion of Spanish Americans and percentage of population receiving government assistance and/or food stamps in the United States with a correlation coefficient (R) of 0.779 and weighted average of 14.0%, a difference of 4.1%.
Receiving Food Stamps Correlation Summary
| Measurement | Immigrants from El Salvador | Spanish American |
| Minimum | 2.5% | 4.5% |
| Maximum | 25.4% | 100.0% |
| Range | 22.9% | 95.5% |
| Mean | 13.1% | 17.4% |
| Median | 12.8% | 14.8% |
| Interquartile 25% (IQ1) | 10.9% | 11.0% |
| Interquartile 75% (IQ3) | 14.7% | 20.4% |
| Interquartile Range (IQR) | 3.8% | 9.4% |
| Standard Deviation (Sample) | 3.8% | 14.3% |
| Standard Deviation (Population) | 3.8% | 14.1% |
Demographics Similar to Immigrants from El Salvador and Spanish Americans by Receiving Food Stamps
In terms of receiving food stamps, the demographic groups most similar to Immigrants from El Salvador are French American Indian (13.5%, a difference of 0.20%), Crow (13.4%, a difference of 0.22%), Immigrants from Micronesia (13.5%, a difference of 0.42%), Immigrants from Zaire (13.4%, a difference of 0.67%), and Iroquois (13.5%, a difference of 0.72%). Similarly, the demographic groups most similar to Spanish Americans are Ghanaian (14.0%, a difference of 0.37%), Marshallese (14.1%, a difference of 0.60%), Subsaharan African (14.1%, a difference of 0.61%), Yaqui (13.9%, a difference of 0.82%), and Immigrants from Cambodia (13.9%, a difference of 0.89%).
| Demographics | Rating | Rank | Receiving Food Stamps |
| Immigrants | Zaire | 1.9 /100 | #235 | Tragic 13.4% |
| Crow | 1.6 /100 | #236 | Tragic 13.4% |
| Immigrants | El Salvador | 1.5 /100 | #237 | Tragic 13.5% |
| French American Indians | 1.4 /100 | #238 | Tragic 13.5% |
| Immigrants | Micronesia | 1.3 /100 | #239 | Tragic 13.5% |
| Iroquois | 1.2 /100 | #240 | Tragic 13.5% |
| Choctaw | 1.0 /100 | #241 | Tragic 13.6% |
| Immigrants | Panama | 1.0 /100 | #242 | Tragic 13.6% |
| Somalis | 0.9 /100 | #243 | Tragic 13.7% |
| Cajuns | 0.9 /100 | #244 | Tragic 13.7% |
| Immigrants | Somalia | 0.9 /100 | #245 | Tragic 13.7% |
| Cree | 0.8 /100 | #246 | Tragic 13.7% |
| Mexican American Indians | 0.7 /100 | #247 | Tragic 13.8% |
| Immigrants | Laos | 0.7 /100 | #248 | Tragic 13.8% |
| Indonesians | 0.6 /100 | #249 | Tragic 13.9% |
| Immigrants | Cambodia | 0.5 /100 | #250 | Tragic 13.9% |
| Yaqui | 0.5 /100 | #251 | Tragic 13.9% |
| Ghanaians | 0.5 /100 | #252 | Tragic 14.0% |
| Spanish Americans | 0.4 /100 | #253 | Tragic 14.0% |
| Marshallese | 0.3 /100 | #254 | Tragic 14.1% |
| Sub-Saharan Africans | 0.3 /100 | #255 | Tragic 14.1% |