Immigrants from Egypt vs Croatian Child Poverty Under the Age of 16
COMPARE
Immigrants from Egypt
Croatian
Child Poverty Under the Age of 16
Child Poverty Under the Age of 16 Comparison
Immigrants from Egypt
Croatians
14.8%
CHILD POVERTY UNDER THE AGE OF 16
94.9/ 100
METRIC RATING
103rd/ 347
METRIC RANK
13.8%
CHILD POVERTY UNDER THE AGE OF 16
99.4/ 100
METRIC RATING
41st/ 347
METRIC RANK
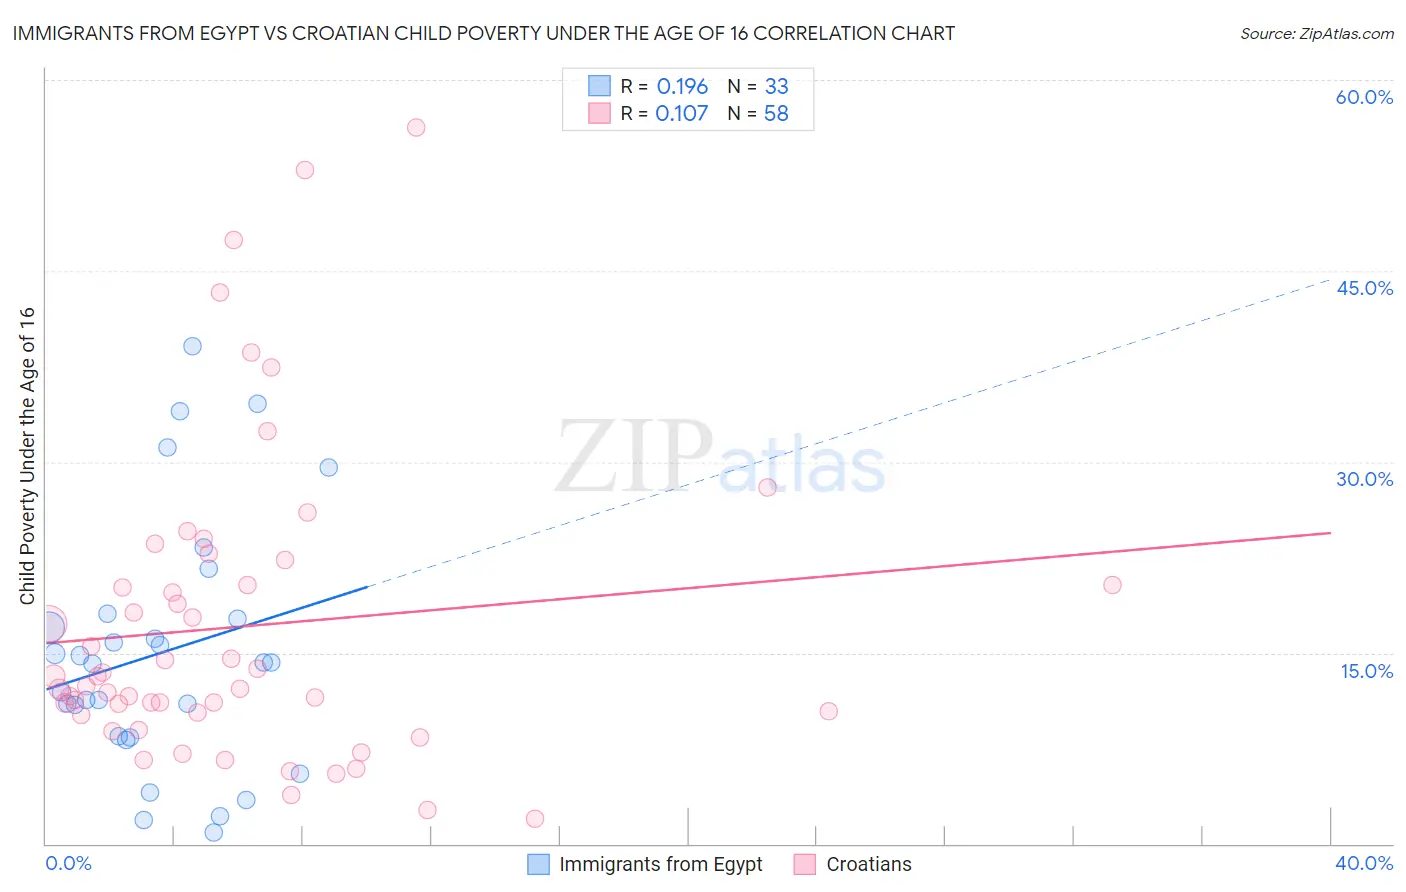
Immigrants from Egypt vs Croatian Child Poverty Under the Age of 16 Correlation Chart
The statistical analysis conducted on geographies consisting of 244,047,631 people shows a poor positive correlation between the proportion of Immigrants from Egypt and poverty level among children under the age of 16 in the United States with a correlation coefficient (R) of 0.196 and weighted average of 14.8%. Similarly, the statistical analysis conducted on geographies consisting of 371,525,585 people shows a poor positive correlation between the proportion of Croatians and poverty level among children under the age of 16 in the United States with a correlation coefficient (R) of 0.107 and weighted average of 13.8%, a difference of 7.5%.
Child Poverty Under the Age of 16 Correlation Summary
| Measurement | Immigrants from Egypt | Croatian |
| Minimum | 0.84% | 2.0% |
| Maximum | 39.1% | 56.2% |
| Range | 38.3% | 54.3% |
| Mean | 15.0% | 17.1% |
| Median | 14.3% | 12.8% |
| Interquartile 25% (IQ1) | 8.4% | 10.3% |
| Interquartile 75% (IQ3) | 17.9% | 20.3% |
| Interquartile Range (IQR) | 9.5% | 10.0% |
| Standard Deviation (Sample) | 9.7% | 12.0% |
| Standard Deviation (Population) | 9.6% | 11.9% |
Similar Demographics by Child Poverty Under the Age of 16
Demographics Similar to Immigrants from Egypt by Child Poverty Under the Age of 16
In terms of child poverty under the age of 16, the demographic groups most similar to Immigrants from Egypt are Immigrants from England (14.8%, a difference of 0.040%), Romanian (14.8%, a difference of 0.050%), Immigrants from Switzerland (14.8%, a difference of 0.11%), Dutch (14.8%, a difference of 0.13%), and Basque (14.8%, a difference of 0.15%).
| Demographics | Rating | Rank | Child Poverty Under the Age of 16 |
| Immigrants | France | 95.8 /100 | #96 | Exceptional 14.7% |
| Paraguayans | 95.7 /100 | #97 | Exceptional 14.7% |
| Immigrants | Belarus | 95.7 /100 | #98 | Exceptional 14.7% |
| British | 95.5 /100 | #99 | Exceptional 14.7% |
| Dutch | 95.1 /100 | #100 | Exceptional 14.8% |
| Immigrants | Switzerland | 95.1 /100 | #101 | Exceptional 14.8% |
| Romanians | 95.0 /100 | #102 | Exceptional 14.8% |
| Immigrants | Egypt | 94.9 /100 | #103 | Exceptional 14.8% |
| Immigrants | England | 94.8 /100 | #104 | Exceptional 14.8% |
| Basques | 94.7 /100 | #105 | Exceptional 14.8% |
| Serbians | 94.5 /100 | #106 | Exceptional 14.8% |
| Chileans | 94.4 /100 | #107 | Exceptional 14.8% |
| Jordanians | 94.2 /100 | #108 | Exceptional 14.8% |
| Tlingit-Haida | 94.1 /100 | #109 | Exceptional 14.9% |
| English | 93.5 /100 | #110 | Exceptional 14.9% |
Demographics Similar to Croatians by Child Poverty Under the Age of 16
In terms of child poverty under the age of 16, the demographic groups most similar to Croatians are Immigrants from Sri Lanka (13.8%, a difference of 0.080%), Immigrants from Moldova (13.8%, a difference of 0.14%), Immigrants from Scotland (13.7%, a difference of 0.16%), Greek (13.8%, a difference of 0.31%), and Czech (13.8%, a difference of 0.37%).
| Demographics | Rating | Rank | Child Poverty Under the Age of 16 |
| Russians | 99.6 /100 | #34 | Exceptional 13.5% |
| Lithuanians | 99.6 /100 | #35 | Exceptional 13.5% |
| Immigrants | Northern Europe | 99.6 /100 | #36 | Exceptional 13.6% |
| Immigrants | Bolivia | 99.6 /100 | #37 | Exceptional 13.6% |
| Luxembourgers | 99.5 /100 | #38 | Exceptional 13.6% |
| Immigrants | Australia | 99.5 /100 | #39 | Exceptional 13.6% |
| Immigrants | Scotland | 99.4 /100 | #40 | Exceptional 13.7% |
| Croatians | 99.4 /100 | #41 | Exceptional 13.8% |
| Immigrants | Sri Lanka | 99.3 /100 | #42 | Exceptional 13.8% |
| Immigrants | Moldova | 99.3 /100 | #43 | Exceptional 13.8% |
| Greeks | 99.3 /100 | #44 | Exceptional 13.8% |
| Czechs | 99.3 /100 | #45 | Exceptional 13.8% |
| Immigrants | Asia | 99.2 /100 | #46 | Exceptional 13.8% |
| Estonians | 99.2 /100 | #47 | Exceptional 13.9% |
| Koreans | 99.2 /100 | #48 | Exceptional 13.9% |