Immigrants from Ecuador vs Immigrants from Kuwait Single Mother Poverty
COMPARE
Immigrants from Ecuador
Immigrants from Kuwait
Single Mother Poverty
Single Mother Poverty Comparison
Immigrants from Ecuador
Immigrants from Kuwait
31.3%
SINGLE MOTHER POVERTY
0.2/ 100
METRIC RATING
264th/ 347
METRIC RANK
28.3%
SINGLE MOTHER POVERTY
92.7/ 100
METRIC RATING
115th/ 347
METRIC RANK
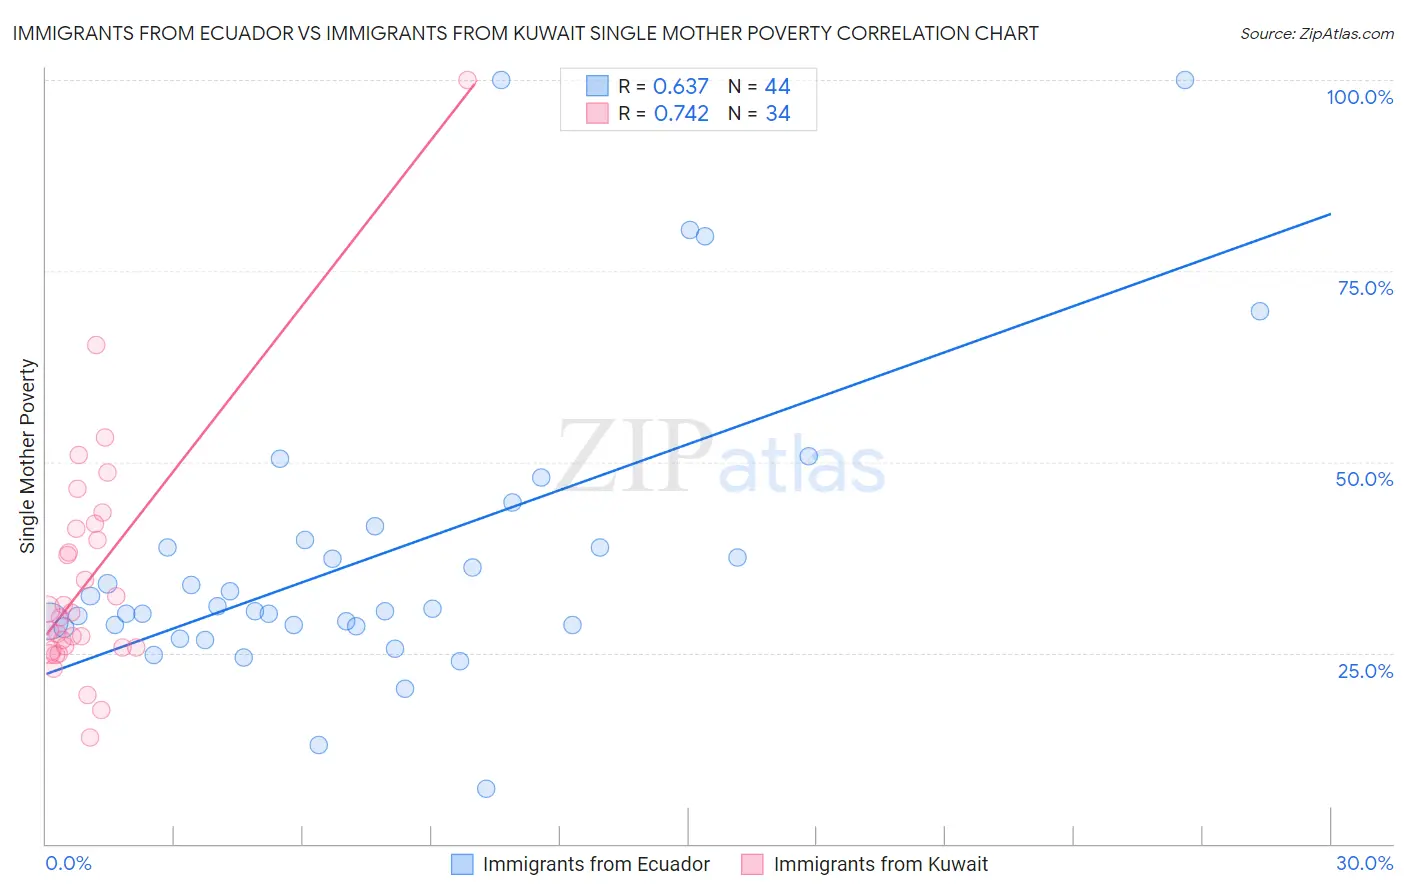
Immigrants from Ecuador vs Immigrants from Kuwait Single Mother Poverty Correlation Chart
The statistical analysis conducted on geographies consisting of 266,047,722 people shows a significant positive correlation between the proportion of Immigrants from Ecuador and poverty level among single mothers in the United States with a correlation coefficient (R) of 0.637 and weighted average of 31.3%. Similarly, the statistical analysis conducted on geographies consisting of 135,603,884 people shows a strong positive correlation between the proportion of Immigrants from Kuwait and poverty level among single mothers in the United States with a correlation coefficient (R) of 0.742 and weighted average of 28.3%, a difference of 10.8%.
Single Mother Poverty Correlation Summary
| Measurement | Immigrants from Ecuador | Immigrants from Kuwait |
| Minimum | 7.3% | 13.9% |
| Maximum | 100.0% | 100.0% |
| Range | 92.7% | 86.1% |
| Mean | 37.8% | 34.8% |
| Median | 30.6% | 30.0% |
| Interquartile 25% (IQ1) | 28.6% | 25.7% |
| Interquartile 75% (IQ3) | 39.3% | 41.3% |
| Interquartile Range (IQR) | 10.8% | 15.6% |
| Standard Deviation (Sample) | 19.7% | 16.0% |
| Standard Deviation (Population) | 19.5% | 15.7% |
Similar Demographics by Single Mother Poverty
Demographics Similar to Immigrants from Ecuador by Single Mother Poverty
In terms of single mother poverty, the demographic groups most similar to Immigrants from Ecuador are Bahamian (31.3%, a difference of 0.020%), German Russian (31.3%, a difference of 0.030%), Subsaharan African (31.4%, a difference of 0.090%), Immigrants from Belize (31.4%, a difference of 0.25%), and Hmong (31.2%, a difference of 0.28%).
| Demographics | Rating | Rank | Single Mother Poverty |
| Immigrants | Bahamas | 0.4 /100 | #257 | Tragic 31.1% |
| Immigrants | Caribbean | 0.4 /100 | #258 | Tragic 31.1% |
| Immigrants | Bangladesh | 0.4 /100 | #259 | Tragic 31.1% |
| Whites/Caucasians | 0.3 /100 | #260 | Tragic 31.2% |
| Immigrants | El Salvador | 0.3 /100 | #261 | Tragic 31.2% |
| Hmong | 0.3 /100 | #262 | Tragic 31.2% |
| Bahamians | 0.2 /100 | #263 | Tragic 31.3% |
| Immigrants | Ecuador | 0.2 /100 | #264 | Tragic 31.3% |
| German Russians | 0.2 /100 | #265 | Tragic 31.3% |
| Sub-Saharan Africans | 0.2 /100 | #266 | Tragic 31.4% |
| Immigrants | Belize | 0.2 /100 | #267 | Tragic 31.4% |
| Immigrants | Senegal | 0.1 /100 | #268 | Tragic 31.5% |
| Scotch-Irish | 0.1 /100 | #269 | Tragic 31.5% |
| British West Indians | 0.1 /100 | #270 | Tragic 31.5% |
| Immigrants | Cabo Verde | 0.1 /100 | #271 | Tragic 31.6% |
Demographics Similar to Immigrants from Kuwait by Single Mother Poverty
In terms of single mother poverty, the demographic groups most similar to Immigrants from Kuwait are Immigrants from Western Asia (28.3%, a difference of 0.010%), Immigrants from Uganda (28.3%, a difference of 0.020%), Australian (28.3%, a difference of 0.030%), Brazilian (28.3%, a difference of 0.040%), and Immigrants from Syria (28.3%, a difference of 0.050%).
| Demographics | Rating | Rank | Single Mother Poverty |
| Immigrants | Zimbabwe | 95.5 /100 | #108 | Exceptional 28.1% |
| Immigrants | Armenia | 95.2 /100 | #109 | Exceptional 28.1% |
| Croatians | 94.8 /100 | #110 | Exceptional 28.2% |
| Venezuelans | 94.5 /100 | #111 | Exceptional 28.2% |
| Immigrants | Kazakhstan | 94.5 /100 | #112 | Exceptional 28.2% |
| Immigrants | South Africa | 93.2 /100 | #113 | Exceptional 28.3% |
| Immigrants | Western Asia | 92.7 /100 | #114 | Exceptional 28.3% |
| Immigrants | Kuwait | 92.7 /100 | #115 | Exceptional 28.3% |
| Immigrants | Uganda | 92.5 /100 | #116 | Exceptional 28.3% |
| Australians | 92.5 /100 | #117 | Exceptional 28.3% |
| Brazilians | 92.4 /100 | #118 | Exceptional 28.3% |
| Immigrants | Syria | 92.4 /100 | #119 | Exceptional 28.3% |
| Cypriots | 92.3 /100 | #120 | Exceptional 28.3% |
| Immigrants | Afghanistan | 92.1 /100 | #121 | Exceptional 28.3% |
| Colombians | 91.8 /100 | #122 | Exceptional 28.3% |