Immigrants from Eastern Europe vs Immigrants from France Child Poverty Among Boys Under 16
COMPARE
Immigrants from Eastern Europe
Immigrants from France
Child Poverty Among Boys Under 16
Child Poverty Among Boys Under 16 Comparison
Immigrants from Eastern Europe
Immigrants from France
14.7%
CHILD POVERTY AMONG BOYS UNDER 16
97.8/ 100
METRIC RATING
79th/ 347
METRIC RANK
15.0%
CHILD POVERTY AMONG BOYS UNDER 16
96.1/ 100
METRIC RATING
99th/ 347
METRIC RANK
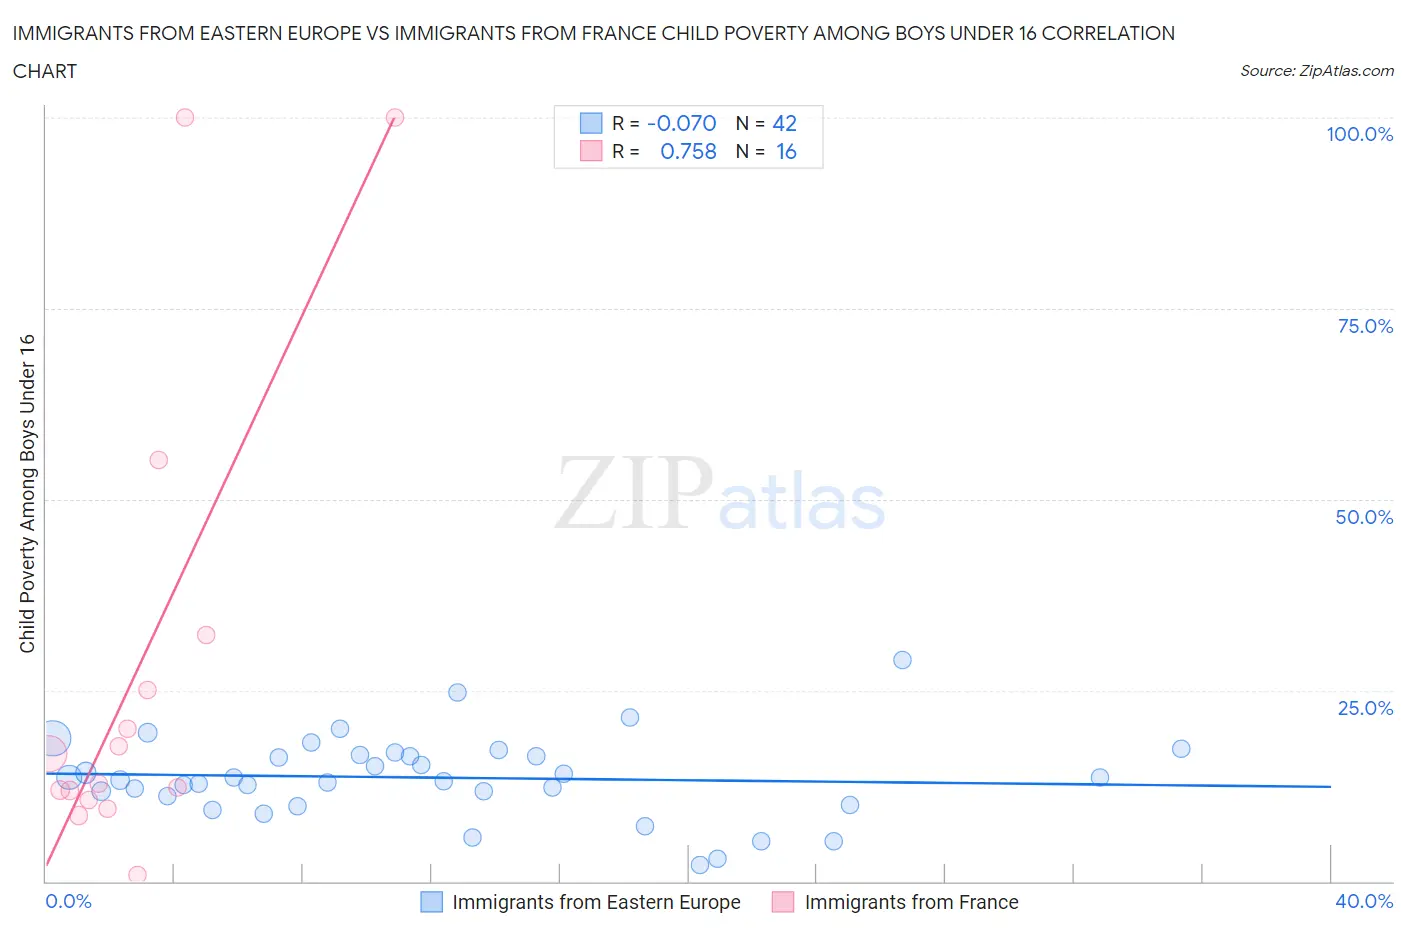
Immigrants from Eastern Europe vs Immigrants from France Child Poverty Among Boys Under 16 Correlation Chart
The statistical analysis conducted on geographies consisting of 463,403,145 people shows a slight negative correlation between the proportion of Immigrants from Eastern Europe and poverty level among boys under the age of 16 in the United States with a correlation coefficient (R) of -0.070 and weighted average of 14.7%. Similarly, the statistical analysis conducted on geographies consisting of 283,890,815 people shows a strong positive correlation between the proportion of Immigrants from France and poverty level among boys under the age of 16 in the United States with a correlation coefficient (R) of 0.758 and weighted average of 15.0%, a difference of 1.8%.
Child Poverty Among Boys Under 16 Correlation Summary
| Measurement | Immigrants from Eastern Europe | Immigrants from France |
| Minimum | 2.2% | 0.76% |
| Maximum | 28.9% | 100.0% |
| Range | 26.7% | 99.2% |
| Mean | 13.6% | 27.8% |
| Median | 13.4% | 14.8% |
| Interquartile 25% (IQ1) | 11.2% | 11.2% |
| Interquartile 75% (IQ3) | 16.5% | 28.7% |
| Interquartile Range (IQR) | 5.3% | 17.5% |
| Standard Deviation (Sample) | 5.4% | 30.8% |
| Standard Deviation (Population) | 5.3% | 29.8% |
Demographics Similar to Immigrants from Eastern Europe and Immigrants from France by Child Poverty Among Boys Under 16
In terms of child poverty among boys under 16, the demographic groups most similar to Immigrants from Eastern Europe are Immigrants from Russia (14.7%, a difference of 0.080%), Immigrants from Canada (14.7%, a difference of 0.22%), Ukrainian (14.7%, a difference of 0.24%), Immigrants from South Africa (14.8%, a difference of 0.47%), and Swiss (14.8%, a difference of 0.60%). Similarly, the demographic groups most similar to Immigrants from France are British (15.0%, a difference of 0.090%), Immigrants from Egypt (14.9%, a difference of 0.14%), Immigrants from North Macedonia (14.9%, a difference of 0.15%), Finnish (14.9%, a difference of 0.40%), and Immigrants from Italy (14.9%, a difference of 0.50%).
| Demographics | Rating | Rank | Child Poverty Among Boys Under 16 |
| Immigrants | Eastern Europe | 97.8 /100 | #79 | Exceptional 14.7% |
| Immigrants | Russia | 97.7 /100 | #80 | Exceptional 14.7% |
| Immigrants | Canada | 97.6 /100 | #81 | Exceptional 14.7% |
| Ukrainians | 97.6 /100 | #82 | Exceptional 14.7% |
| Immigrants | South Africa | 97.4 /100 | #83 | Exceptional 14.8% |
| Swiss | 97.3 /100 | #84 | Exceptional 14.8% |
| Taiwanese | 97.3 /100 | #85 | Exceptional 14.8% |
| Germans | 97.2 /100 | #86 | Exceptional 14.8% |
| Northern Europeans | 97.2 /100 | #87 | Exceptional 14.8% |
| Immigrants | North America | 97.1 /100 | #88 | Exceptional 14.8% |
| Immigrants | Argentina | 97.1 /100 | #89 | Exceptional 14.8% |
| Austrians | 97.1 /100 | #90 | Exceptional 14.8% |
| Paraguayans | 96.8 /100 | #91 | Exceptional 14.9% |
| Argentineans | 96.7 /100 | #92 | Exceptional 14.9% |
| Sri Lankans | 96.7 /100 | #93 | Exceptional 14.9% |
| Immigrants | Italy | 96.7 /100 | #94 | Exceptional 14.9% |
| Finns | 96.5 /100 | #95 | Exceptional 14.9% |
| Immigrants | North Macedonia | 96.3 /100 | #96 | Exceptional 14.9% |
| Immigrants | Egypt | 96.2 /100 | #97 | Exceptional 14.9% |
| British | 96.2 /100 | #98 | Exceptional 15.0% |
| Immigrants | France | 96.1 /100 | #99 | Exceptional 15.0% |