Immigrants from Eastern Asia vs Alaskan Athabascan Seniors Poverty Over the Age of 65
COMPARE
Immigrants from Eastern Asia
Alaskan Athabascan
Seniors Poverty Over the Age of 65
Seniors Poverty Over the Age of 65 Comparison
Immigrants from Eastern Asia
Alaskan Athabascans
11.1%
SENIORS POVERTY OVER THE AGE OF 65
37.5/ 100
METRIC RATING
186th/ 347
METRIC RANK
10.6%
SENIORS POVERTY OVER THE AGE OF 65
79.1/ 100
METRIC RATING
146th/ 347
METRIC RANK
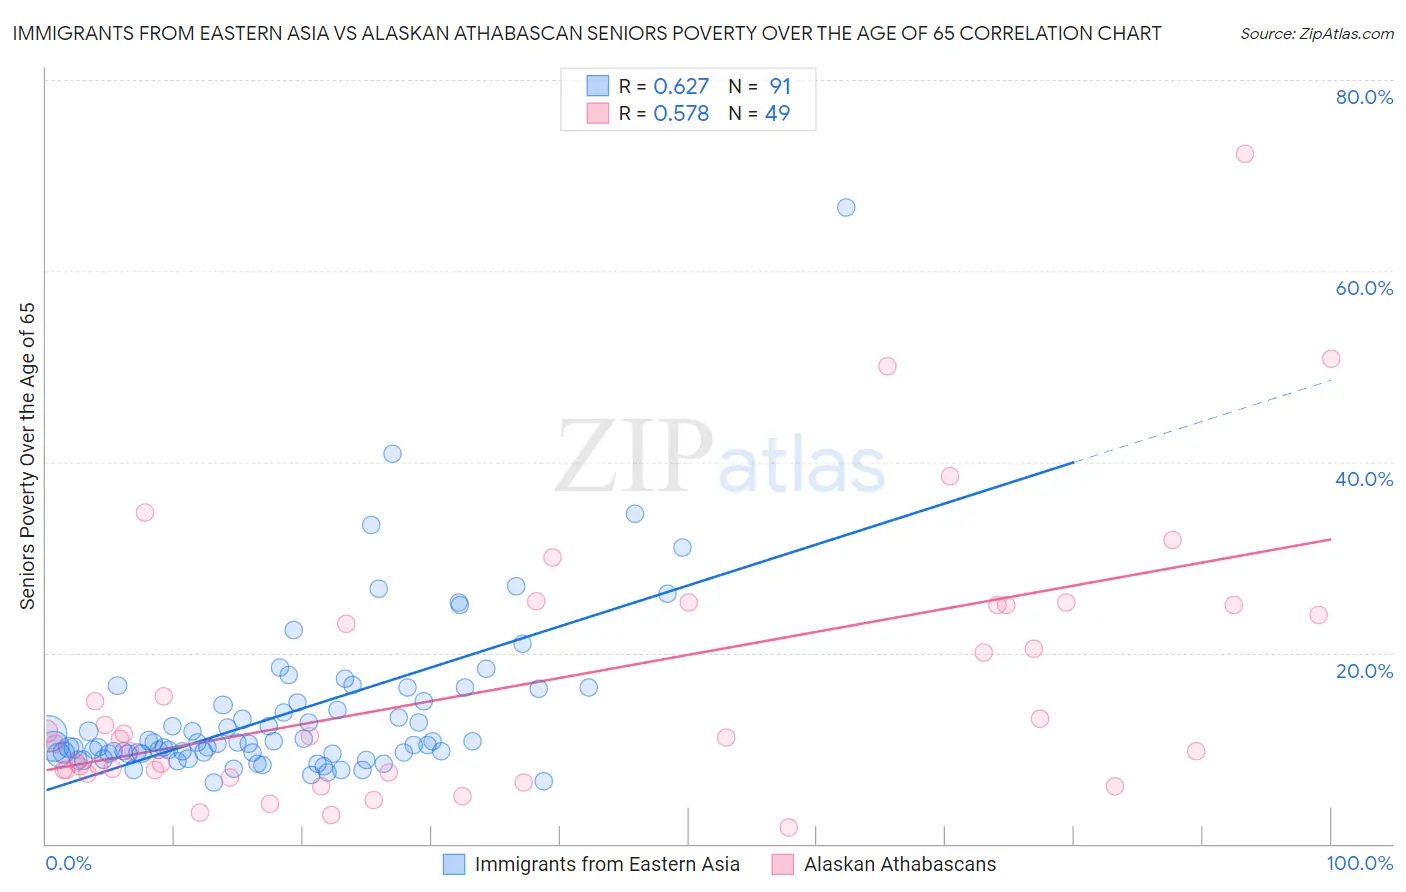
Immigrants from Eastern Asia vs Alaskan Athabascan Seniors Poverty Over the Age of 65 Correlation Chart
The statistical analysis conducted on geographies consisting of 496,949,586 people shows a significant positive correlation between the proportion of Immigrants from Eastern Asia and poverty level among seniors over the age of 65 in the United States with a correlation coefficient (R) of 0.627 and weighted average of 11.1%. Similarly, the statistical analysis conducted on geographies consisting of 45,753,118 people shows a substantial positive correlation between the proportion of Alaskan Athabascans and poverty level among seniors over the age of 65 in the United States with a correlation coefficient (R) of 0.578 and weighted average of 10.6%, a difference of 4.2%.
Seniors Poverty Over the Age of 65 Correlation Summary
| Measurement | Immigrants from Eastern Asia | Alaskan Athabascan |
| Minimum | 6.4% | 1.7% |
| Maximum | 66.7% | 72.2% |
| Range | 60.3% | 70.5% |
| Mean | 13.7% | 16.6% |
| Median | 10.5% | 11.1% |
| Interquartile 25% (IQ1) | 9.5% | 7.6% |
| Interquartile 75% (IQ3) | 14.9% | 25.0% |
| Interquartile Range (IQR) | 5.5% | 17.4% |
| Standard Deviation (Sample) | 8.7% | 14.2% |
| Standard Deviation (Population) | 8.6% | 14.0% |
Similar Demographics by Seniors Poverty Over the Age of 65
Demographics Similar to Immigrants from Eastern Asia by Seniors Poverty Over the Age of 65
In terms of seniors poverty over the age of 65, the demographic groups most similar to Immigrants from Eastern Asia are Immigrants from Middle Africa (11.1%, a difference of 0.010%), Immigrants from Lebanon (11.1%, a difference of 0.060%), Immigrants from Hong Kong (11.1%, a difference of 0.11%), Immigrants from Laos (11.1%, a difference of 0.17%), and Immigrants from France (11.0%, a difference of 0.31%).
| Demographics | Rating | Rank | Seniors Poverty Over the Age of 65 |
| Immigrants | Northern Africa | 44.6 /100 | #179 | Average 11.0% |
| Immigrants | Thailand | 43.5 /100 | #180 | Average 11.0% |
| Immigrants | Eastern Africa | 43.4 /100 | #181 | Average 11.0% |
| Immigrants | Fiji | 42.0 /100 | #182 | Average 11.0% |
| Immigrants | Kazakhstan | 41.0 /100 | #183 | Average 11.0% |
| Immigrants | France | 40.9 /100 | #184 | Average 11.0% |
| Immigrants | Lebanon | 38.2 /100 | #185 | Fair 11.1% |
| Immigrants | Eastern Asia | 37.5 /100 | #186 | Fair 11.1% |
| Immigrants | Middle Africa | 37.4 /100 | #187 | Fair 11.1% |
| Immigrants | Hong Kong | 36.3 /100 | #188 | Fair 11.1% |
| Immigrants | Laos | 35.7 /100 | #189 | Fair 11.1% |
| Indians (Asian) | 34.2 /100 | #190 | Fair 11.1% |
| Immigrants | Uganda | 32.2 /100 | #191 | Fair 11.1% |
| Immigrants | Southern Europe | 30.1 /100 | #192 | Fair 11.1% |
| Taiwanese | 29.2 /100 | #193 | Fair 11.2% |
Demographics Similar to Alaskan Athabascans by Seniors Poverty Over the Age of 65
In terms of seniors poverty over the age of 65, the demographic groups most similar to Alaskan Athabascans are Immigrants from Greece (10.6%, a difference of 0.020%), Laotian (10.6%, a difference of 0.10%), American (10.6%, a difference of 0.14%), Immigrants from Cameroon (10.6%, a difference of 0.15%), and Iraqi (10.6%, a difference of 0.22%).
| Demographics | Rating | Rank | Seniors Poverty Over the Age of 65 |
| Portuguese | 84.1 /100 | #139 | Excellent 10.5% |
| Immigrants | Kenya | 83.4 /100 | #140 | Excellent 10.5% |
| Immigrants | Europe | 83.3 /100 | #141 | Excellent 10.5% |
| Osage | 82.8 /100 | #142 | Excellent 10.6% |
| Immigrants | Asia | 80.8 /100 | #143 | Excellent 10.6% |
| Iraqis | 80.7 /100 | #144 | Excellent 10.6% |
| Laotians | 79.9 /100 | #145 | Good 10.6% |
| Alaskan Athabascans | 79.1 /100 | #146 | Good 10.6% |
| Immigrants | Greece | 79.0 /100 | #147 | Good 10.6% |
| Americans | 78.1 /100 | #148 | Good 10.6% |
| Immigrants | Cameroon | 78.1 /100 | #149 | Good 10.6% |
| Immigrants | Switzerland | 77.3 /100 | #150 | Good 10.6% |
| Spanish | 76.8 /100 | #151 | Good 10.6% |
| Immigrants | Egypt | 76.5 /100 | #152 | Good 10.6% |
| Fijians | 75.6 /100 | #153 | Good 10.7% |