Immigrants from Eastern Africa vs Syrian Seniors Poverty Over the Age of 65
COMPARE
Immigrants from Eastern Africa
Syrian
Seniors Poverty Over the Age of 65
Seniors Poverty Over the Age of 65 Comparison
Immigrants from Eastern Africa
Syrians
11.0%
SENIORS POVERTY OVER THE AGE OF 65
43.4/ 100
METRIC RATING
181st/ 347
METRIC RANK
10.3%
SENIORS POVERTY OVER THE AGE OF 65
93.8/ 100
METRIC RATING
109th/ 347
METRIC RANK
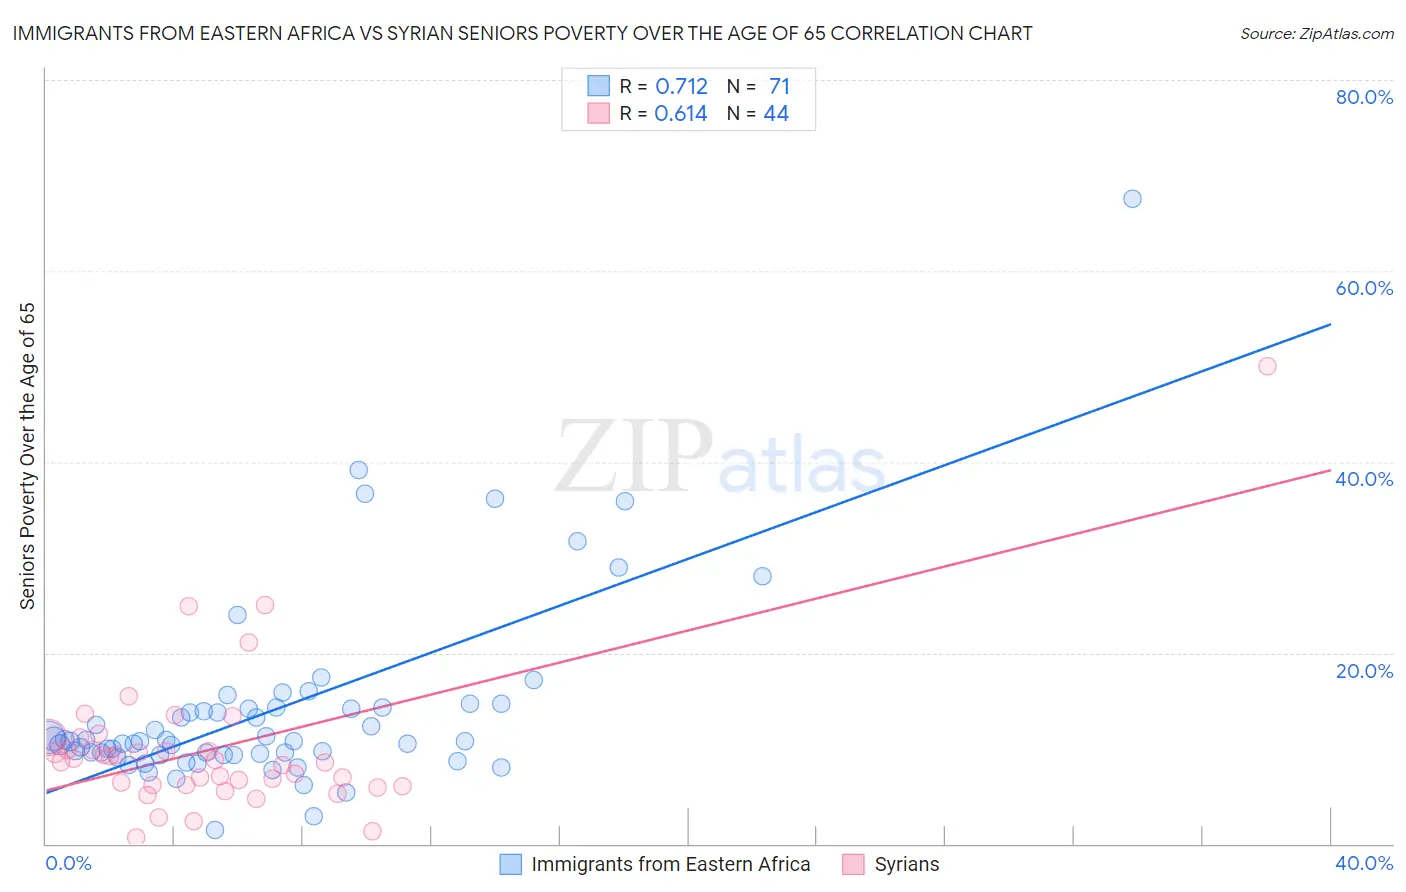
Immigrants from Eastern Africa vs Syrian Seniors Poverty Over the Age of 65 Correlation Chart
The statistical analysis conducted on geographies consisting of 354,026,621 people shows a strong positive correlation between the proportion of Immigrants from Eastern Africa and poverty level among seniors over the age of 65 in the United States with a correlation coefficient (R) of 0.712 and weighted average of 11.0%. Similarly, the statistical analysis conducted on geographies consisting of 265,840,687 people shows a significant positive correlation between the proportion of Syrians and poverty level among seniors over the age of 65 in the United States with a correlation coefficient (R) of 0.614 and weighted average of 10.3%, a difference of 7.1%.
Seniors Poverty Over the Age of 65 Correlation Summary
| Measurement | Immigrants from Eastern Africa | Syrian |
| Minimum | 1.4% | 0.62% |
| Maximum | 67.5% | 50.0% |
| Range | 66.1% | 49.4% |
| Mean | 14.0% | 10.0% |
| Median | 10.7% | 8.7% |
| Interquartile 25% (IQ1) | 9.3% | 6.1% |
| Interquartile 75% (IQ3) | 14.2% | 10.5% |
| Interquartile Range (IQR) | 4.9% | 4.3% |
| Standard Deviation (Sample) | 10.0% | 8.0% |
| Standard Deviation (Population) | 10.0% | 7.9% |
Similar Demographics by Seniors Poverty Over the Age of 65
Demographics Similar to Immigrants from Eastern Africa by Seniors Poverty Over the Age of 65
In terms of seniors poverty over the age of 65, the demographic groups most similar to Immigrants from Eastern Africa are Immigrants from Thailand (11.0%, a difference of 0.0%), Immigrants from Northern Africa (11.0%, a difference of 0.10%), Immigrants from Fiji (11.0%, a difference of 0.13%), Immigrants from Kazakhstan (11.0%, a difference of 0.22%), and Immigrants from France (11.0%, a difference of 0.23%).
| Demographics | Rating | Rank | Seniors Poverty Over the Age of 65 |
| Immigrants | Sudan | 50.0 /100 | #174 | Average 10.9% |
| Creek | 49.6 /100 | #175 | Average 10.9% |
| Immigrants | Malaysia | 47.9 /100 | #176 | Average 11.0% |
| Cherokee | 47.3 /100 | #177 | Average 11.0% |
| German Russians | 46.9 /100 | #178 | Average 11.0% |
| Immigrants | Northern Africa | 44.6 /100 | #179 | Average 11.0% |
| Immigrants | Thailand | 43.5 /100 | #180 | Average 11.0% |
| Immigrants | Eastern Africa | 43.4 /100 | #181 | Average 11.0% |
| Immigrants | Fiji | 42.0 /100 | #182 | Average 11.0% |
| Immigrants | Kazakhstan | 41.0 /100 | #183 | Average 11.0% |
| Immigrants | France | 40.9 /100 | #184 | Average 11.0% |
| Immigrants | Lebanon | 38.2 /100 | #185 | Fair 11.1% |
| Immigrants | Eastern Asia | 37.5 /100 | #186 | Fair 11.1% |
| Immigrants | Middle Africa | 37.4 /100 | #187 | Fair 11.1% |
| Immigrants | Hong Kong | 36.3 /100 | #188 | Fair 11.1% |
Demographics Similar to Syrians by Seniors Poverty Over the Age of 65
In terms of seniors poverty over the age of 65, the demographic groups most similar to Syrians are Immigrants from Croatia (10.3%, a difference of 0.020%), Hawaiian (10.3%, a difference of 0.030%), Kenyan (10.3%, a difference of 0.10%), Aleut (10.3%, a difference of 0.12%), and Immigrants from Zimbabwe (10.3%, a difference of 0.14%).
| Demographics | Rating | Rank | Seniors Poverty Over the Age of 65 |
| Delaware | 94.5 /100 | #102 | Exceptional 10.2% |
| Icelanders | 94.4 /100 | #103 | Exceptional 10.3% |
| South Africans | 94.3 /100 | #104 | Exceptional 10.3% |
| Aleuts | 94.1 /100 | #105 | Exceptional 10.3% |
| Kenyans | 94.1 /100 | #106 | Exceptional 10.3% |
| Hawaiians | 93.9 /100 | #107 | Exceptional 10.3% |
| Immigrants | Croatia | 93.9 /100 | #108 | Exceptional 10.3% |
| Syrians | 93.8 /100 | #109 | Exceptional 10.3% |
| Immigrants | Zimbabwe | 93.5 /100 | #110 | Exceptional 10.3% |
| Immigrants | Belgium | 93.4 /100 | #111 | Exceptional 10.3% |
| Immigrants | Korea | 93.3 /100 | #112 | Exceptional 10.3% |
| Immigrants | Romania | 93.3 /100 | #113 | Exceptional 10.3% |
| Immigrants | Denmark | 92.7 /100 | #114 | Exceptional 10.3% |
| Immigrants | Italy | 92.6 /100 | #115 | Exceptional 10.3% |
| Pakistanis | 92.2 /100 | #116 | Exceptional 10.3% |