Immigrants from Dominica vs Immigrants from Fiji Female Poverty Among 18-24 Year Olds
COMPARE
Immigrants from Dominica
Immigrants from Fiji
Female Poverty Among 18-24 Year Olds
Female Poverty Among 18-24 Year Olds Comparison
Immigrants from Dominica
Immigrants from Fiji
21.9%
FEMALE POVERTY AMONG 18-24 YEAR OLDS
0.1/ 100
METRIC RATING
280th/ 347
METRIC RANK
17.7%
FEMALE POVERTY AMONG 18-24 YEAR OLDS
100.0/ 100
METRIC RATING
26th/ 347
METRIC RANK
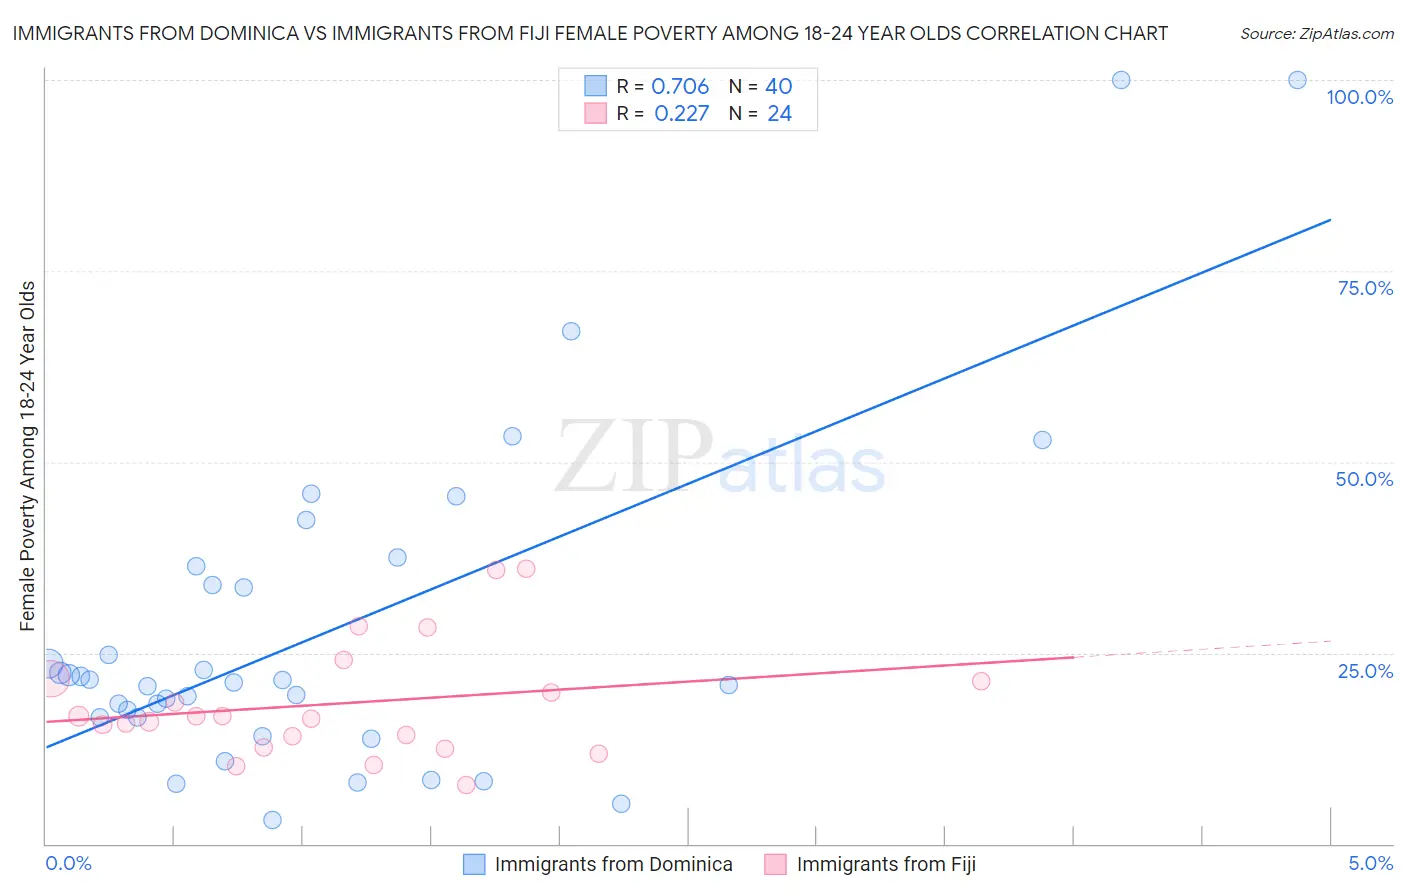
Immigrants from Dominica vs Immigrants from Fiji Female Poverty Among 18-24 Year Olds Correlation Chart
The statistical analysis conducted on geographies consisting of 83,465,633 people shows a strong positive correlation between the proportion of Immigrants from Dominica and poverty level among females between the ages 18 and 24 in the United States with a correlation coefficient (R) of 0.706 and weighted average of 21.9%. Similarly, the statistical analysis conducted on geographies consisting of 93,267,707 people shows a weak positive correlation between the proportion of Immigrants from Fiji and poverty level among females between the ages 18 and 24 in the United States with a correlation coefficient (R) of 0.227 and weighted average of 17.7%, a difference of 24.2%.
Female Poverty Among 18-24 Year Olds Correlation Summary
| Measurement | Immigrants from Dominica | Immigrants from Fiji |
| Minimum | 3.1% | 7.6% |
| Maximum | 100.0% | 36.1% |
| Range | 96.9% | 28.5% |
| Mean | 27.9% | 18.4% |
| Median | 21.3% | 16.5% |
| Interquartile 25% (IQ1) | 16.5% | 13.4% |
| Interquartile 75% (IQ3) | 35.0% | 21.5% |
| Interquartile Range (IQR) | 18.6% | 8.1% |
| Standard Deviation (Sample) | 22.0% | 7.5% |
| Standard Deviation (Population) | 21.7% | 7.4% |
Similar Demographics by Female Poverty Among 18-24 Year Olds
Demographics Similar to Immigrants from Dominica by Female Poverty Among 18-24 Year Olds
In terms of female poverty among 18-24 year olds, the demographic groups most similar to Immigrants from Dominica are Spanish American (21.9%, a difference of 0.010%), Immigrants from Dominican Republic (21.9%, a difference of 0.040%), Bermudan (21.9%, a difference of 0.13%), Yaqui (21.9%, a difference of 0.18%), and Subsaharan African (22.0%, a difference of 0.43%).
| Demographics | Rating | Rank | Female Poverty Among 18-24 Year Olds |
| New Zealanders | 0.2 /100 | #273 | Tragic 21.7% |
| Immigrants | Honduras | 0.1 /100 | #274 | Tragic 21.8% |
| Immigrants | Bangladesh | 0.1 /100 | #275 | Tragic 21.8% |
| Bahamians | 0.1 /100 | #276 | Tragic 21.8% |
| Immigrants | Switzerland | 0.1 /100 | #277 | Tragic 21.8% |
| Yaqui | 0.1 /100 | #278 | Tragic 21.9% |
| Spanish Americans | 0.1 /100 | #279 | Tragic 21.9% |
| Immigrants | Dominica | 0.1 /100 | #280 | Tragic 21.9% |
| Immigrants | Dominican Republic | 0.1 /100 | #281 | Tragic 21.9% |
| Bermudans | 0.1 /100 | #282 | Tragic 21.9% |
| Sub-Saharan Africans | 0.0 /100 | #283 | Tragic 22.0% |
| Tlingit-Haida | 0.0 /100 | #284 | Tragic 22.0% |
| Ottawa | 0.0 /100 | #285 | Tragic 22.0% |
| Ugandans | 0.0 /100 | #286 | Tragic 22.1% |
| Immigrants | Middle Africa | 0.0 /100 | #287 | Tragic 22.1% |
Demographics Similar to Immigrants from Fiji by Female Poverty Among 18-24 Year Olds
In terms of female poverty among 18-24 year olds, the demographic groups most similar to Immigrants from Fiji are Colombian (17.7%, a difference of 0.11%), Venezuelan (17.7%, a difference of 0.24%), Immigrants from South Central Asia (17.6%, a difference of 0.33%), Maltese (17.6%, a difference of 0.51%), and Immigrants from North Macedonia (17.6%, a difference of 0.57%).
| Demographics | Rating | Rank | Female Poverty Among 18-24 Year Olds |
| Immigrants | Lithuania | 100.0 /100 | #19 | Exceptional 17.4% |
| Immigrants | Venezuela | 100.0 /100 | #20 | Exceptional 17.4% |
| Bolivians | 100.0 /100 | #21 | Exceptional 17.4% |
| Immigrants | Hong Kong | 100.0 /100 | #22 | Exceptional 17.5% |
| Immigrants | North Macedonia | 100.0 /100 | #23 | Exceptional 17.6% |
| Maltese | 100.0 /100 | #24 | Exceptional 17.6% |
| Immigrants | South Central Asia | 100.0 /100 | #25 | Exceptional 17.6% |
| Immigrants | Fiji | 100.0 /100 | #26 | Exceptional 17.7% |
| Colombians | 100.0 /100 | #27 | Exceptional 17.7% |
| Venezuelans | 100.0 /100 | #28 | Exceptional 17.7% |
| Portuguese | 100.0 /100 | #29 | Exceptional 17.8% |
| Immigrants | South Eastern Asia | 100.0 /100 | #30 | Exceptional 17.8% |
| Immigrants | Vietnam | 100.0 /100 | #31 | Exceptional 17.8% |
| Immigrants | Moldova | 100.0 /100 | #32 | Exceptional 17.9% |
| Native Hawaiians | 100.0 /100 | #33 | Exceptional 17.9% |