Immigrants from Denmark vs Portuguese Single Mother Poverty
COMPARE
Immigrants from Denmark
Portuguese
Single Mother Poverty
Single Mother Poverty Comparison
Immigrants from Denmark
Portuguese
28.5%
SINGLE MOTHER POVERTY
86.1/ 100
METRIC RATING
146th/ 347
METRIC RANK
28.8%
SINGLE MOTHER POVERTY
73.2/ 100
METRIC RATING
154th/ 347
METRIC RANK
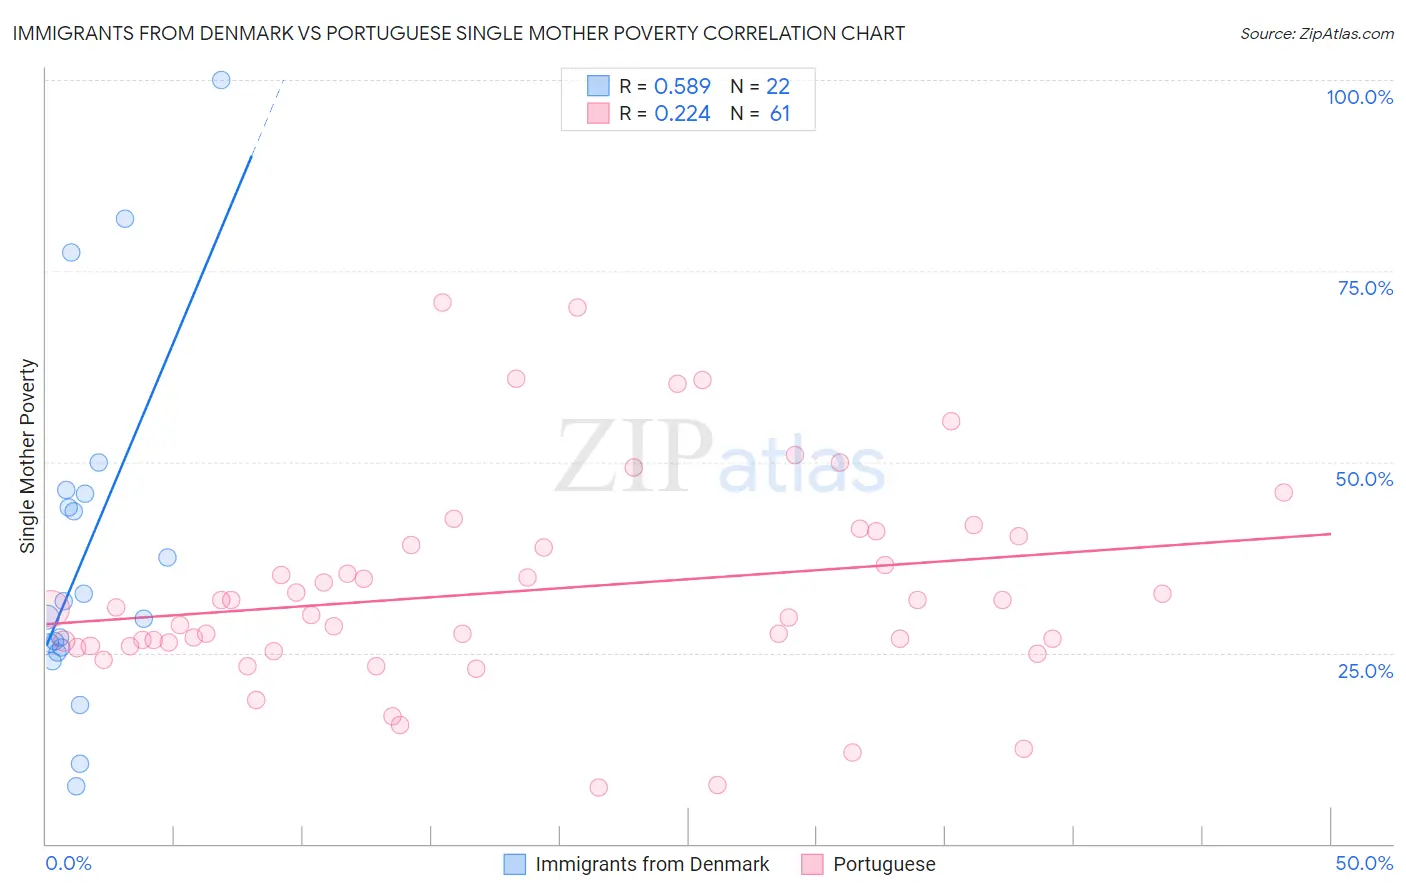
Immigrants from Denmark vs Portuguese Single Mother Poverty Correlation Chart
The statistical analysis conducted on geographies consisting of 134,367,924 people shows a substantial positive correlation between the proportion of Immigrants from Denmark and poverty level among single mothers in the United States with a correlation coefficient (R) of 0.589 and weighted average of 28.5%. Similarly, the statistical analysis conducted on geographies consisting of 435,396,736 people shows a weak positive correlation between the proportion of Portuguese and poverty level among single mothers in the United States with a correlation coefficient (R) of 0.224 and weighted average of 28.8%, a difference of 1.0%.
Single Mother Poverty Correlation Summary
| Measurement | Immigrants from Denmark | Portuguese |
| Minimum | 7.5% | 7.4% |
| Maximum | 100.0% | 70.8% |
| Range | 92.5% | 63.4% |
| Mean | 38.2% | 33.1% |
| Median | 30.7% | 30.8% |
| Interquartile 25% (IQ1) | 25.7% | 25.9% |
| Interquartile 75% (IQ3) | 45.8% | 39.7% |
| Interquartile Range (IQR) | 20.1% | 13.8% |
| Standard Deviation (Sample) | 22.7% | 13.6% |
| Standard Deviation (Population) | 22.2% | 13.5% |
Demographics Similar to Immigrants from Denmark and Portuguese by Single Mother Poverty
In terms of single mother poverty, the demographic groups most similar to Immigrants from Denmark are Immigrants from South America (28.5%, a difference of 0.0%), Luxembourger (28.5%, a difference of 0.040%), Immigrants from North America (28.5%, a difference of 0.050%), South African (28.5%, a difference of 0.060%), and Immigrants from Lebanon (28.6%, a difference of 0.070%). Similarly, the demographic groups most similar to Portuguese are Ugandan (28.8%, a difference of 0.090%), Iraqi (28.8%, a difference of 0.10%), Immigrants from Western Europe (28.9%, a difference of 0.13%), Immigrants from Hungary (28.9%, a difference of 0.16%), and Slovene (28.8%, a difference of 0.21%).
| Demographics | Rating | Rank | Single Mother Poverty |
| Immigrants | Colombia | 88.0 /100 | #140 | Excellent 28.5% |
| Danes | 87.1 /100 | #141 | Excellent 28.5% |
| South Africans | 86.6 /100 | #142 | Excellent 28.5% |
| Immigrants | North America | 86.5 /100 | #143 | Excellent 28.5% |
| Luxembourgers | 86.4 /100 | #144 | Excellent 28.5% |
| Immigrants | South America | 86.1 /100 | #145 | Excellent 28.5% |
| Immigrants | Denmark | 86.1 /100 | #146 | Excellent 28.5% |
| Immigrants | Lebanon | 85.3 /100 | #147 | Excellent 28.6% |
| Syrians | 85.3 /100 | #148 | Excellent 28.6% |
| Serbians | 85.0 /100 | #149 | Excellent 28.6% |
| Northern Europeans | 81.7 /100 | #150 | Excellent 28.6% |
| Immigrants | Oceania | 79.9 /100 | #151 | Good 28.7% |
| Austrians | 79.0 /100 | #152 | Good 28.7% |
| Slovenes | 76.4 /100 | #153 | Good 28.8% |
| Portuguese | 73.2 /100 | #154 | Good 28.8% |
| Ugandans | 71.7 /100 | #155 | Good 28.8% |
| Iraqis | 71.5 /100 | #156 | Good 28.8% |
| Immigrants | Western Europe | 71.1 /100 | #157 | Good 28.9% |
| Immigrants | Hungary | 70.6 /100 | #158 | Good 28.9% |
| Czechs | 68.4 /100 | #159 | Good 28.9% |
| Japanese | 68.0 /100 | #160 | Good 28.9% |