Immigrants from Czechoslovakia vs Immigrants from Bulgaria Child Poverty Under the Age of 16
COMPARE
Immigrants from Czechoslovakia
Immigrants from Bulgaria
Child Poverty Under the Age of 16
Child Poverty Under the Age of 16 Comparison
Immigrants from Czechoslovakia
Immigrants from Bulgaria
13.9%
CHILD POVERTY UNDER THE AGE OF 16
99.1/ 100
METRIC RATING
50th/ 347
METRIC RANK
14.3%
CHILD POVERTY UNDER THE AGE OF 16
98.0/ 100
METRIC RATING
69th/ 347
METRIC RANK
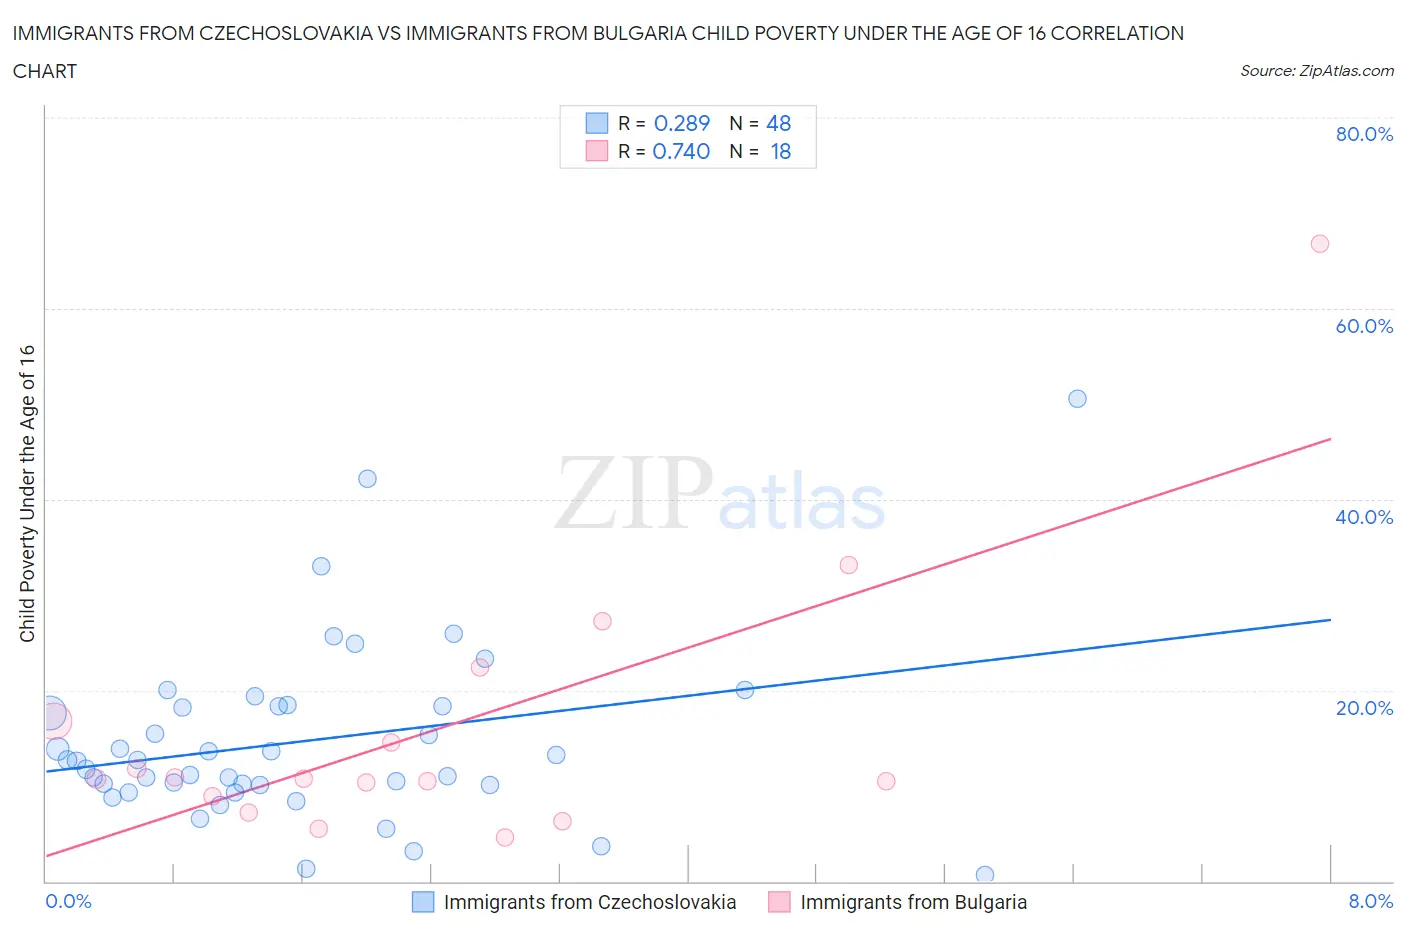
Immigrants from Czechoslovakia vs Immigrants from Bulgaria Child Poverty Under the Age of 16 Correlation Chart
The statistical analysis conducted on geographies consisting of 194,220,646 people shows a weak positive correlation between the proportion of Immigrants from Czechoslovakia and poverty level among children under the age of 16 in the United States with a correlation coefficient (R) of 0.289 and weighted average of 13.9%. Similarly, the statistical analysis conducted on geographies consisting of 171,715,259 people shows a strong positive correlation between the proportion of Immigrants from Bulgaria and poverty level among children under the age of 16 in the United States with a correlation coefficient (R) of 0.740 and weighted average of 14.3%, a difference of 2.9%.
Child Poverty Under the Age of 16 Correlation Summary
| Measurement | Immigrants from Czechoslovakia | Immigrants from Bulgaria |
| Minimum | 0.66% | 4.6% |
| Maximum | 50.5% | 66.8% |
| Range | 49.9% | 62.2% |
| Mean | 14.7% | 16.1% |
| Median | 12.6% | 10.8% |
| Interquartile 25% (IQ1) | 10.1% | 8.9% |
| Interquartile 75% (IQ3) | 18.3% | 16.8% |
| Interquartile Range (IQR) | 8.2% | 7.9% |
| Standard Deviation (Sample) | 9.3% | 14.7% |
| Standard Deviation (Population) | 9.3% | 14.3% |
Demographics Similar to Immigrants from Czechoslovakia and Immigrants from Bulgaria by Child Poverty Under the Age of 16
In terms of child poverty under the age of 16, the demographic groups most similar to Immigrants from Czechoslovakia are Immigrants from Greece (13.9%, a difference of 0.12%), Italian (13.9%, a difference of 0.23%), Polish (14.0%, a difference of 0.89%), Immigrants from Israel (14.1%, a difference of 1.2%), and Tsimshian (14.1%, a difference of 1.2%). Similarly, the demographic groups most similar to Immigrants from Bulgaria are Laotian (14.3%, a difference of 0.080%), European (14.3%, a difference of 0.18%), Slovene (14.3%, a difference of 0.21%), Immigrants from Philippines (14.3%, a difference of 0.39%), and Immigrants from Romania (14.2%, a difference of 0.65%).
| Demographics | Rating | Rank | Child Poverty Under the Age of 16 |
| Italians | 99.2 /100 | #49 | Exceptional 13.9% |
| Immigrants | Czechoslovakia | 99.1 /100 | #50 | Exceptional 13.9% |
| Immigrants | Greece | 99.1 /100 | #51 | Exceptional 13.9% |
| Poles | 98.9 /100 | #52 | Exceptional 14.0% |
| Immigrants | Israel | 98.8 /100 | #53 | Exceptional 14.1% |
| Tsimshian | 98.8 /100 | #54 | Exceptional 14.1% |
| Immigrants | Indonesia | 98.7 /100 | #55 | Exceptional 14.1% |
| Immigrants | Serbia | 98.7 /100 | #56 | Exceptional 14.1% |
| Immigrants | Belgium | 98.6 /100 | #57 | Exceptional 14.1% |
| Immigrants | Pakistan | 98.6 /100 | #58 | Exceptional 14.1% |
| Scandinavians | 98.6 /100 | #59 | Exceptional 14.1% |
| Immigrants | Austria | 98.5 /100 | #60 | Exceptional 14.2% |
| Immigrants | Sweden | 98.5 /100 | #61 | Exceptional 14.2% |
| Zimbabweans | 98.5 /100 | #62 | Exceptional 14.2% |
| Immigrants | Europe | 98.4 /100 | #63 | Exceptional 14.2% |
| Immigrants | Romania | 98.3 /100 | #64 | Exceptional 14.2% |
| Immigrants | Philippines | 98.2 /100 | #65 | Exceptional 14.3% |
| Slovenes | 98.1 /100 | #66 | Exceptional 14.3% |
| Europeans | 98.1 /100 | #67 | Exceptional 14.3% |
| Laotians | 98.0 /100 | #68 | Exceptional 14.3% |
| Immigrants | Bulgaria | 98.0 /100 | #69 | Exceptional 14.3% |