Immigrants from Cuba vs Immigrants from Taiwan Family Poverty
COMPARE
Immigrants from Cuba
Immigrants from Taiwan
Family Poverty
Family Poverty Comparison
Immigrants from Cuba
Immigrants from Taiwan
11.3%
FAMILY POVERTY
0.0/ 100
METRIC RATING
282nd/ 347
METRIC RANK
6.6%
FAMILY POVERTY
100.0/ 100
METRIC RATING
3rd/ 347
METRIC RANK
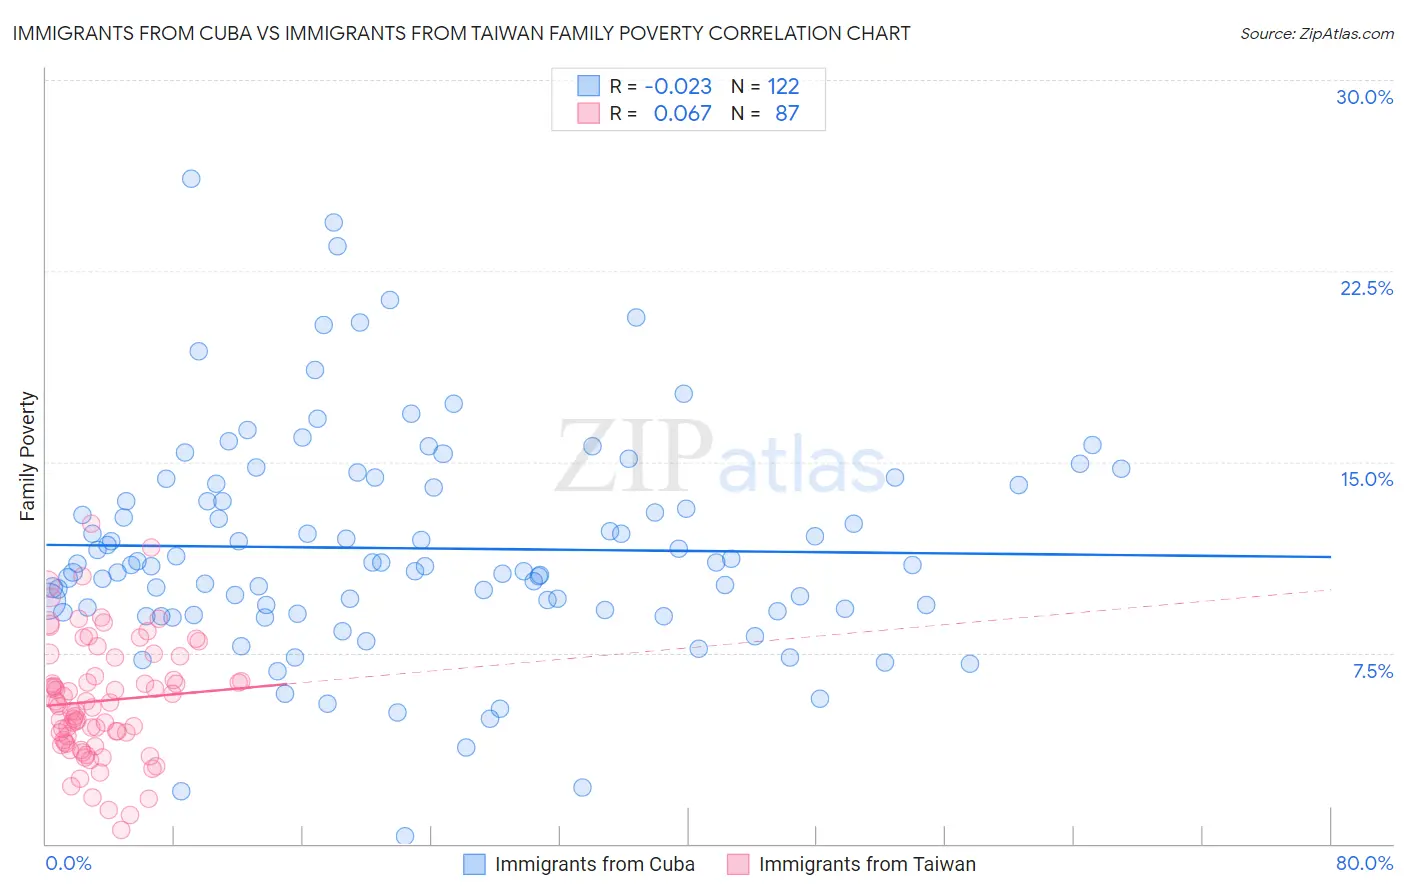
Immigrants from Cuba vs Immigrants from Taiwan Family Poverty Correlation Chart
The statistical analysis conducted on geographies consisting of 325,531,975 people shows no correlation between the proportion of Immigrants from Cuba and poverty level among families in the United States with a correlation coefficient (R) of -0.023 and weighted average of 11.3%. Similarly, the statistical analysis conducted on geographies consisting of 297,599,094 people shows a slight positive correlation between the proportion of Immigrants from Taiwan and poverty level among families in the United States with a correlation coefficient (R) of 0.067 and weighted average of 6.6%, a difference of 71.3%.
Family Poverty Correlation Summary
| Measurement | Immigrants from Cuba | Immigrants from Taiwan |
| Minimum | 0.31% | 0.55% |
| Maximum | 26.1% | 12.6% |
| Range | 25.8% | 12.0% |
| Mean | 11.6% | 5.6% |
| Median | 11.0% | 5.4% |
| Interquartile 25% (IQ1) | 9.2% | 4.0% |
| Interquartile 75% (IQ3) | 14.1% | 7.3% |
| Interquartile Range (IQR) | 4.9% | 3.4% |
| Standard Deviation (Sample) | 4.3% | 2.3% |
| Standard Deviation (Population) | 4.3% | 2.3% |
Similar Demographics by Family Poverty
Demographics Similar to Immigrants from Cuba by Family Poverty
In terms of family poverty, the demographic groups most similar to Immigrants from Cuba are Indonesian (11.3%, a difference of 0.040%), Yaqui (11.3%, a difference of 0.16%), Barbadian (11.3%, a difference of 0.24%), Immigrants from West Indies (11.3%, a difference of 0.26%), and Belizean (11.3%, a difference of 0.53%).
| Demographics | Rating | Rank | Family Poverty |
| Central Americans | 0.1 /100 | #275 | Tragic 11.2% |
| Immigrants | Guyana | 0.1 /100 | #276 | Tragic 11.2% |
| Chippewa | 0.1 /100 | #277 | Tragic 11.2% |
| Guyanese | 0.1 /100 | #278 | Tragic 11.2% |
| Blackfeet | 0.0 /100 | #279 | Tragic 11.3% |
| Belizeans | 0.0 /100 | #280 | Tragic 11.3% |
| Immigrants | West Indies | 0.0 /100 | #281 | Tragic 11.3% |
| Immigrants | Cuba | 0.0 /100 | #282 | Tragic 11.3% |
| Indonesians | 0.0 /100 | #283 | Tragic 11.3% |
| Yaqui | 0.0 /100 | #284 | Tragic 11.3% |
| Barbadians | 0.0 /100 | #285 | Tragic 11.3% |
| Senegalese | 0.0 /100 | #286 | Tragic 11.5% |
| Vietnamese | 0.0 /100 | #287 | Tragic 11.5% |
| Immigrants | Belize | 0.0 /100 | #288 | Tragic 11.5% |
| Immigrants | Barbados | 0.0 /100 | #289 | Tragic 11.5% |
Demographics Similar to Immigrants from Taiwan by Family Poverty
In terms of family poverty, the demographic groups most similar to Immigrants from Taiwan are Filipino (6.6%, a difference of 0.61%), Thai (6.7%, a difference of 1.2%), Chinese (6.5%, a difference of 1.6%), Norwegian (6.9%, a difference of 4.3%), and Immigrants from Ireland (7.0%, a difference of 5.7%).
| Demographics | Rating | Rank | Family Poverty |
| Immigrants | India | 100.0 /100 | #1 | Exceptional 6.2% |
| Chinese | 100.0 /100 | #2 | Exceptional 6.5% |
| Immigrants | Taiwan | 100.0 /100 | #3 | Exceptional 6.6% |
| Filipinos | 100.0 /100 | #4 | Exceptional 6.6% |
| Thais | 100.0 /100 | #5 | Exceptional 6.7% |
| Norwegians | 99.9 /100 | #6 | Exceptional 6.9% |
| Immigrants | Ireland | 99.9 /100 | #7 | Exceptional 7.0% |
| Bhutanese | 99.9 /100 | #8 | Exceptional 7.0% |
| Latvians | 99.9 /100 | #9 | Exceptional 7.1% |
| Bulgarians | 99.8 /100 | #10 | Exceptional 7.1% |
| Immigrants | Singapore | 99.8 /100 | #11 | Exceptional 7.1% |
| Maltese | 99.8 /100 | #12 | Exceptional 7.1% |
| Swedes | 99.8 /100 | #13 | Exceptional 7.1% |
| Iranians | 99.8 /100 | #14 | Exceptional 7.1% |
| Lithuanians | 99.8 /100 | #15 | Exceptional 7.2% |