Immigrants from Croatia vs Immigrants from Bolivia Single Male Poverty
COMPARE
Immigrants from Croatia
Immigrants from Bolivia
Single Male Poverty
Single Male Poverty Comparison
Immigrants from Croatia
Immigrants from Bolivia
11.9%
SINGLE MALE POVERTY
99.6/ 100
METRIC RATING
68th/ 347
METRIC RANK
11.1%
SINGLE MALE POVERTY
100.0/ 100
METRIC RATING
18th/ 347
METRIC RANK
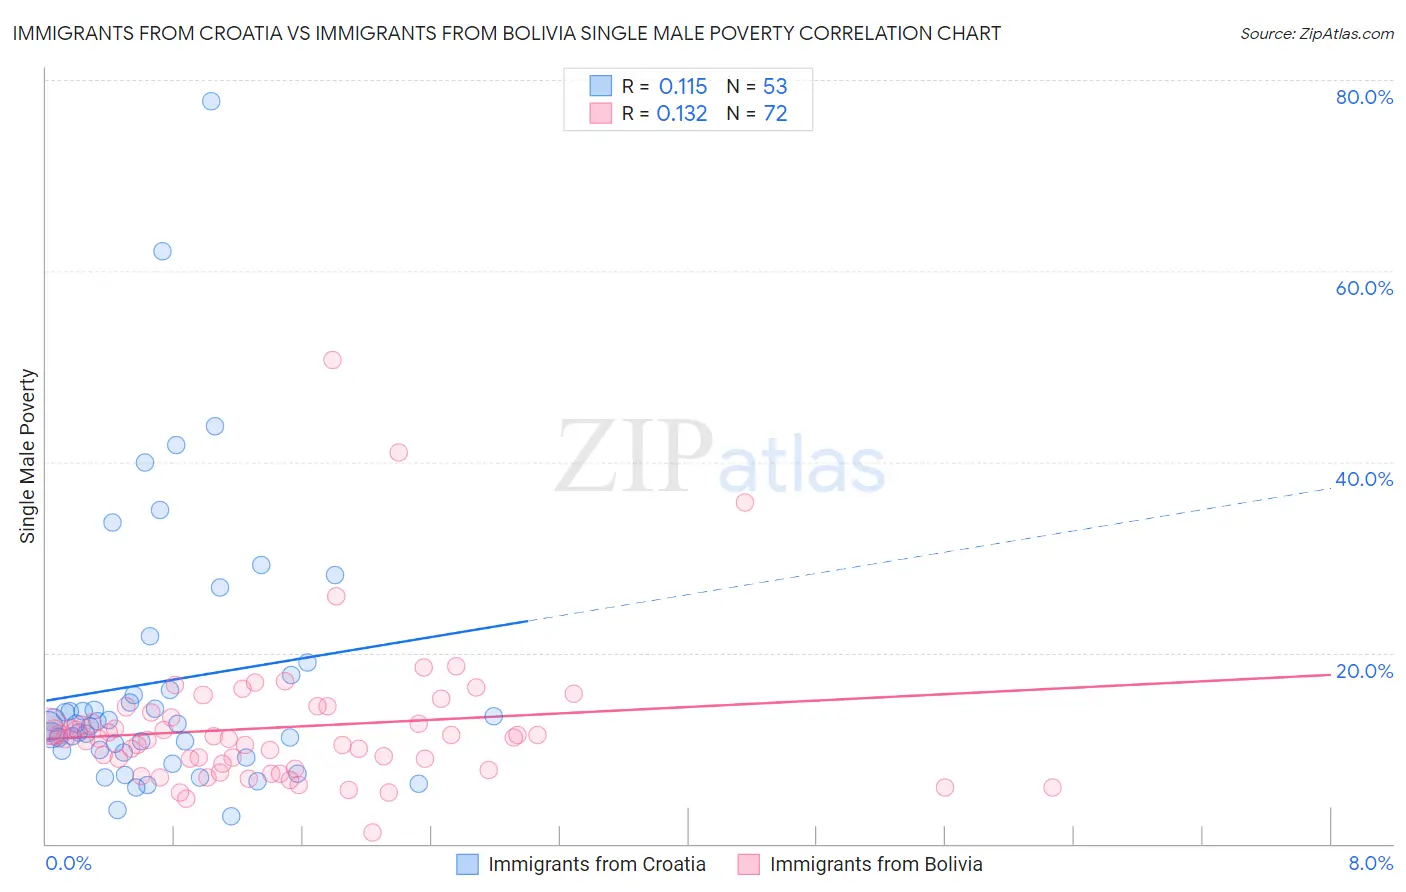
Immigrants from Croatia vs Immigrants from Bolivia Single Male Poverty Correlation Chart
The statistical analysis conducted on geographies consisting of 123,944,071 people shows a poor positive correlation between the proportion of Immigrants from Croatia and poverty level among single males in the United States with a correlation coefficient (R) of 0.115 and weighted average of 11.9%. Similarly, the statistical analysis conducted on geographies consisting of 149,105,633 people shows a poor positive correlation between the proportion of Immigrants from Bolivia and poverty level among single males in the United States with a correlation coefficient (R) of 0.132 and weighted average of 11.1%, a difference of 6.7%.
Single Male Poverty Correlation Summary
| Measurement | Immigrants from Croatia | Immigrants from Bolivia |
| Minimum | 2.8% | 1.2% |
| Maximum | 77.8% | 50.6% |
| Range | 75.0% | 49.4% |
| Mean | 17.0% | 12.2% |
| Median | 12.6% | 11.0% |
| Interquartile 25% (IQ1) | 9.7% | 8.1% |
| Interquartile 75% (IQ3) | 16.9% | 13.5% |
| Interquartile Range (IQR) | 7.2% | 5.4% |
| Standard Deviation (Sample) | 14.3% | 7.6% |
| Standard Deviation (Population) | 14.2% | 7.5% |
Similar Demographics by Single Male Poverty
Demographics Similar to Immigrants from Croatia by Single Male Poverty
In terms of single male poverty, the demographic groups most similar to Immigrants from Croatia are Immigrants from Ukraine (11.9%, a difference of 0.010%), Immigrants from Russia (11.9%, a difference of 0.020%), Laotian (11.9%, a difference of 0.030%), Immigrants from Uruguay (11.9%, a difference of 0.030%), and Immigrants from Nepal (11.9%, a difference of 0.040%).
| Demographics | Rating | Rank | Single Male Poverty |
| Cambodians | 99.8 /100 | #61 | Exceptional 11.8% |
| Immigrants | Sri Lanka | 99.7 /100 | #62 | Exceptional 11.8% |
| Immigrants | Belarus | 99.7 /100 | #63 | Exceptional 11.8% |
| Immigrants | Eastern Europe | 99.6 /100 | #64 | Exceptional 11.8% |
| Laotians | 99.6 /100 | #65 | Exceptional 11.9% |
| Immigrants | Uruguay | 99.6 /100 | #66 | Exceptional 11.9% |
| Immigrants | Ukraine | 99.6 /100 | #67 | Exceptional 11.9% |
| Immigrants | Croatia | 99.6 /100 | #68 | Exceptional 11.9% |
| Immigrants | Russia | 99.6 /100 | #69 | Exceptional 11.9% |
| Immigrants | Nepal | 99.6 /100 | #70 | Exceptional 11.9% |
| Immigrants | Greece | 99.6 /100 | #71 | Exceptional 11.9% |
| Immigrants | Argentina | 99.5 /100 | #72 | Exceptional 11.9% |
| Argentineans | 99.5 /100 | #73 | Exceptional 11.9% |
| Chileans | 99.5 /100 | #74 | Exceptional 11.9% |
| Uruguayans | 99.4 /100 | #75 | Exceptional 11.9% |
Demographics Similar to Immigrants from Bolivia by Single Male Poverty
In terms of single male poverty, the demographic groups most similar to Immigrants from Bolivia are Tsimshian (11.1%, a difference of 0.33%), Immigrants from Moldova (11.2%, a difference of 0.38%), Ethiopian (11.2%, a difference of 0.41%), Bhutanese (11.1%, a difference of 0.42%), and Asian (11.2%, a difference of 0.75%).
| Demographics | Rating | Rank | Single Male Poverty |
| Immigrants | Philippines | 100.0 /100 | #11 | Exceptional 10.9% |
| Immigrants | Afghanistan | 100.0 /100 | #12 | Exceptional 10.9% |
| Immigrants | South Central Asia | 100.0 /100 | #13 | Exceptional 10.9% |
| Chinese | 100.0 /100 | #14 | Exceptional 11.0% |
| Koreans | 100.0 /100 | #15 | Exceptional 11.0% |
| Bhutanese | 100.0 /100 | #16 | Exceptional 11.1% |
| Tsimshian | 100.0 /100 | #17 | Exceptional 11.1% |
| Immigrants | Bolivia | 100.0 /100 | #18 | Exceptional 11.1% |
| Immigrants | Moldova | 100.0 /100 | #19 | Exceptional 11.2% |
| Ethiopians | 100.0 /100 | #20 | Exceptional 11.2% |
| Asians | 100.0 /100 | #21 | Exceptional 11.2% |
| Immigrants | Pakistan | 100.0 /100 | #22 | Exceptional 11.2% |
| Bolivians | 100.0 /100 | #23 | Exceptional 11.2% |
| Indians (Asian) | 100.0 /100 | #24 | Exceptional 11.3% |
| Maltese | 100.0 /100 | #25 | Exceptional 11.3% |