Immigrants from Costa Rica vs Immigrants from Trinidad and Tobago Female Poverty Among 18-24 Year Olds
COMPARE
Immigrants from Costa Rica
Immigrants from Trinidad and Tobago
Female Poverty Among 18-24 Year Olds
Female Poverty Among 18-24 Year Olds Comparison
Immigrants from Costa Rica
Immigrants from Trinidad and Tobago
18.7%
FEMALE POVERTY AMONG 18-24 YEAR OLDS
99.7/ 100
METRIC RATING
70th/ 347
METRIC RANK
19.7%
FEMALE POVERTY AMONG 18-24 YEAR OLDS
85.6/ 100
METRIC RATING
140th/ 347
METRIC RANK
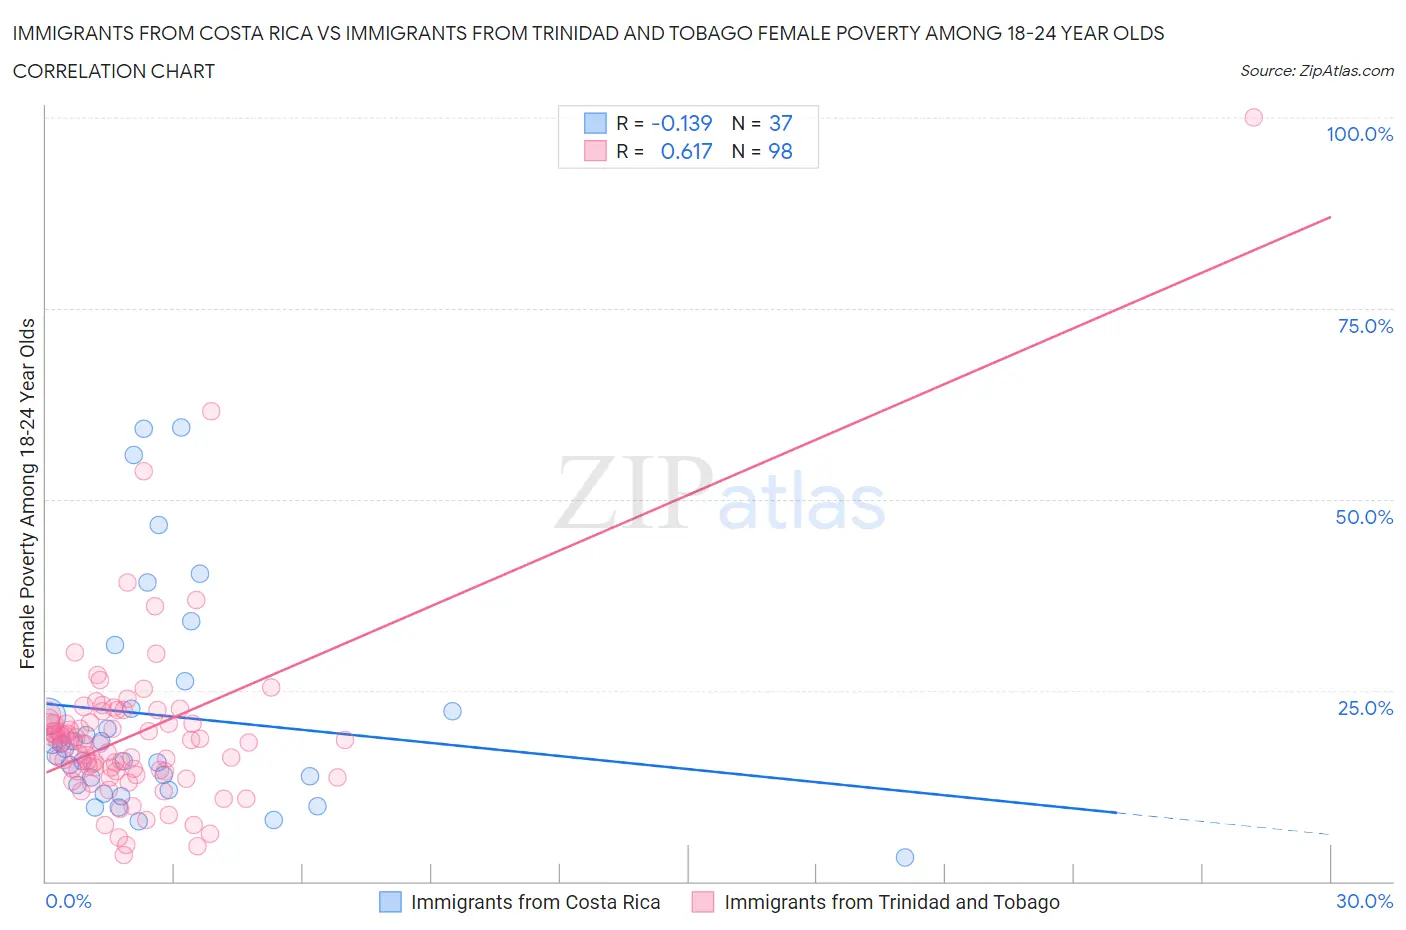
Immigrants from Costa Rica vs Immigrants from Trinidad and Tobago Female Poverty Among 18-24 Year Olds Correlation Chart
The statistical analysis conducted on geographies consisting of 202,109,997 people shows a poor negative correlation between the proportion of Immigrants from Costa Rica and poverty level among females between the ages 18 and 24 in the United States with a correlation coefficient (R) of -0.139 and weighted average of 18.7%. Similarly, the statistical analysis conducted on geographies consisting of 219,818,736 people shows a significant positive correlation between the proportion of Immigrants from Trinidad and Tobago and poverty level among females between the ages 18 and 24 in the United States with a correlation coefficient (R) of 0.617 and weighted average of 19.7%, a difference of 5.3%.
Female Poverty Among 18-24 Year Olds Correlation Summary
| Measurement | Immigrants from Costa Rica | Immigrants from Trinidad and Tobago |
| Minimum | 3.1% | 3.4% |
| Maximum | 59.4% | 100.0% |
| Range | 56.3% | 96.6% |
| Mean | 21.7% | 19.3% |
| Median | 17.3% | 18.2% |
| Interquartile 25% (IQ1) | 12.3% | 14.4% |
| Interquartile 75% (IQ3) | 24.4% | 20.7% |
| Interquartile Range (IQR) | 12.1% | 6.4% |
| Standard Deviation (Sample) | 14.4% | 11.9% |
| Standard Deviation (Population) | 14.2% | 11.8% |
Similar Demographics by Female Poverty Among 18-24 Year Olds
Demographics Similar to Immigrants from Costa Rica by Female Poverty Among 18-24 Year Olds
In terms of female poverty among 18-24 year olds, the demographic groups most similar to Immigrants from Costa Rica are Immigrants from Haiti (18.7%, a difference of 0.060%), Armenian (18.7%, a difference of 0.090%), Immigrants from Bulgaria (18.6%, a difference of 0.11%), Lithuanian (18.7%, a difference of 0.12%), and Brazilian (18.6%, a difference of 0.22%).
| Demographics | Rating | Rank | Female Poverty Among 18-24 Year Olds |
| Immigrants | Belarus | 99.8 /100 | #63 | Exceptional 18.5% |
| Immigrants | Asia | 99.8 /100 | #64 | Exceptional 18.6% |
| Immigrants | Scotland | 99.8 /100 | #65 | Exceptional 18.6% |
| Jordanians | 99.8 /100 | #66 | Exceptional 18.6% |
| Immigrants | Korea | 99.8 /100 | #67 | Exceptional 18.6% |
| Brazilians | 99.8 /100 | #68 | Exceptional 18.6% |
| Immigrants | Bulgaria | 99.7 /100 | #69 | Exceptional 18.6% |
| Immigrants | Costa Rica | 99.7 /100 | #70 | Exceptional 18.7% |
| Immigrants | Haiti | 99.7 /100 | #71 | Exceptional 18.7% |
| Armenians | 99.7 /100 | #72 | Exceptional 18.7% |
| Lithuanians | 99.7 /100 | #73 | Exceptional 18.7% |
| Hawaiians | 99.6 /100 | #74 | Exceptional 18.7% |
| Poles | 99.6 /100 | #75 | Exceptional 18.8% |
| Immigrants | Cambodia | 99.5 /100 | #76 | Exceptional 18.8% |
| Costa Ricans | 99.5 /100 | #77 | Exceptional 18.8% |
Demographics Similar to Immigrants from Trinidad and Tobago by Female Poverty Among 18-24 Year Olds
In terms of female poverty among 18-24 year olds, the demographic groups most similar to Immigrants from Trinidad and Tobago are Pennsylvania German (19.7%, a difference of 0.010%), Panamanian (19.7%, a difference of 0.11%), Slavic (19.7%, a difference of 0.12%), Immigrants from Northern Africa (19.7%, a difference of 0.15%), and Canadian (19.7%, a difference of 0.18%).
| Demographics | Rating | Rank | Female Poverty Among 18-24 Year Olds |
| Turks | 92.1 /100 | #133 | Exceptional 19.5% |
| Immigrants | North America | 92.1 /100 | #134 | Exceptional 19.5% |
| Soviet Union | 92.0 /100 | #135 | Exceptional 19.5% |
| Russians | 91.5 /100 | #136 | Exceptional 19.5% |
| Austrians | 90.7 /100 | #137 | Exceptional 19.5% |
| Immigrants | Morocco | 89.9 /100 | #138 | Excellent 19.6% |
| Indians (Asian) | 88.3 /100 | #139 | Excellent 19.6% |
| Immigrants | Trinidad and Tobago | 85.6 /100 | #140 | Excellent 19.7% |
| Pennsylvania Germans | 85.5 /100 | #141 | Excellent 19.7% |
| Panamanians | 84.6 /100 | #142 | Excellent 19.7% |
| Slavs | 84.4 /100 | #143 | Excellent 19.7% |
| Immigrants | Northern Africa | 84.1 /100 | #144 | Excellent 19.7% |
| Canadians | 83.8 /100 | #145 | Excellent 19.7% |
| Immigrants | Bosnia and Herzegovina | 83.6 /100 | #146 | Excellent 19.7% |
| Immigrants | Austria | 83.1 /100 | #147 | Excellent 19.7% |