Immigrants from Central America vs Russian Family Poverty
COMPARE
Immigrants from Central America
Russian
Family Poverty
Family Poverty Comparison
Immigrants from Central America
Russians
12.1%
FAMILY POVERTY
0.0/ 100
METRIC RATING
312th/ 347
METRIC RANK
7.5%
FAMILY POVERTY
99.5/ 100
METRIC RATING
34th/ 347
METRIC RANK
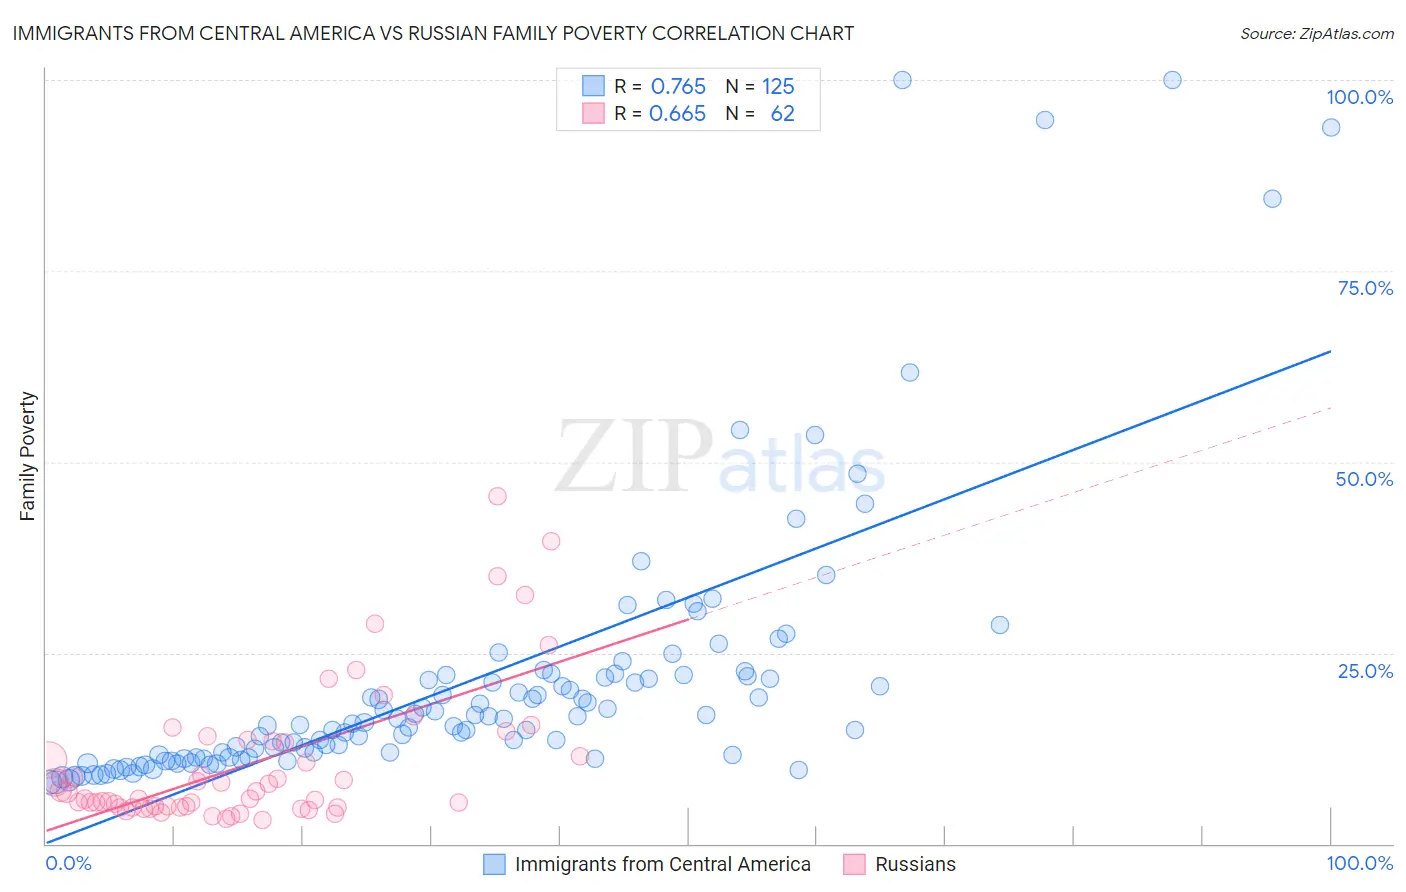
Immigrants from Central America vs Russian Family Poverty Correlation Chart
The statistical analysis conducted on geographies consisting of 533,860,839 people shows a strong positive correlation between the proportion of Immigrants from Central America and poverty level among families in the United States with a correlation coefficient (R) of 0.765 and weighted average of 12.1%. Similarly, the statistical analysis conducted on geographies consisting of 509,085,697 people shows a significant positive correlation between the proportion of Russians and poverty level among families in the United States with a correlation coefficient (R) of 0.665 and weighted average of 7.5%, a difference of 62.4%.
Family Poverty Correlation Summary
| Measurement | Immigrants from Central America | Russian |
| Minimum | 8.0% | 3.2% |
| Maximum | 100.0% | 45.5% |
| Range | 92.0% | 42.3% |
| Mean | 21.3% | 10.6% |
| Median | 15.8% | 6.3% |
| Interquartile 25% (IQ1) | 11.3% | 4.8% |
| Interquartile 75% (IQ3) | 22.0% | 13.4% |
| Interquartile Range (IQR) | 10.7% | 8.6% |
| Standard Deviation (Sample) | 17.9% | 9.4% |
| Standard Deviation (Population) | 17.8% | 9.3% |
Similar Demographics by Family Poverty
Demographics Similar to Immigrants from Central America by Family Poverty
In terms of family poverty, the demographic groups most similar to Immigrants from Central America are Ute (12.1%, a difference of 0.38%), Immigrants from Caribbean (12.2%, a difference of 0.68%), Kiowa (12.2%, a difference of 1.2%), Hispanic or Latino (12.0%, a difference of 1.2%), and Immigrants from Guatemala (12.0%, a difference of 1.2%).
| Demographics | Rating | Rank | Family Poverty |
| Mexicans | 0.0 /100 | #305 | Tragic 11.8% |
| Cajuns | 0.0 /100 | #306 | Tragic 11.9% |
| Immigrants | Congo | 0.0 /100 | #307 | Tragic 11.9% |
| Seminole | 0.0 /100 | #308 | Tragic 11.9% |
| Hispanics or Latinos | 0.0 /100 | #309 | Tragic 12.0% |
| Immigrants | Guatemala | 0.0 /100 | #310 | Tragic 12.0% |
| Ute | 0.0 /100 | #311 | Tragic 12.1% |
| Immigrants | Central America | 0.0 /100 | #312 | Tragic 12.1% |
| Immigrants | Caribbean | 0.0 /100 | #313 | Tragic 12.2% |
| Kiowa | 0.0 /100 | #314 | Tragic 12.2% |
| Immigrants | Mexico | 0.0 /100 | #315 | Tragic 12.3% |
| Hondurans | 0.0 /100 | #316 | Tragic 12.4% |
| Immigrants | Grenada | 0.0 /100 | #317 | Tragic 12.4% |
| U.S. Virgin Islanders | 0.0 /100 | #318 | Tragic 12.4% |
| British West Indians | 0.0 /100 | #319 | Tragic 12.4% |
Demographics Similar to Russians by Family Poverty
In terms of family poverty, the demographic groups most similar to Russians are Polish (7.4%, a difference of 0.23%), Immigrants from Japan (7.4%, a difference of 0.23%), Czech (7.4%, a difference of 0.53%), Italian (7.4%, a difference of 0.65%), and Greek (7.5%, a difference of 0.73%).
| Demographics | Rating | Rank | Family Poverty |
| Immigrants | Scotland | 99.6 /100 | #27 | Exceptional 7.3% |
| Immigrants | Korea | 99.6 /100 | #28 | Exceptional 7.4% |
| Immigrants | Northern Europe | 99.6 /100 | #29 | Exceptional 7.4% |
| Italians | 99.6 /100 | #30 | Exceptional 7.4% |
| Czechs | 99.6 /100 | #31 | Exceptional 7.4% |
| Poles | 99.5 /100 | #32 | Exceptional 7.4% |
| Immigrants | Japan | 99.5 /100 | #33 | Exceptional 7.4% |
| Russians | 99.5 /100 | #34 | Exceptional 7.5% |
| Greeks | 99.4 /100 | #35 | Exceptional 7.5% |
| Turks | 99.4 /100 | #36 | Exceptional 7.5% |
| Estonians | 99.4 /100 | #37 | Exceptional 7.5% |
| Bolivians | 99.3 /100 | #38 | Exceptional 7.5% |
| Carpatho Rusyns | 99.3 /100 | #39 | Exceptional 7.5% |
| Slovenes | 99.3 /100 | #40 | Exceptional 7.5% |
| Immigrants | Australia | 99.2 /100 | #41 | Exceptional 7.6% |