Immigrants from Central America vs Immigrants from Africa Seniors Poverty Over the Age of 75
COMPARE
Immigrants from Central America
Immigrants from Africa
Seniors Poverty Over the Age of 75
Seniors Poverty Over the Age of 75 Comparison
Immigrants from Central America
Immigrants from Africa
15.0%
SENIORS POVERTY OVER THE AGE OF 75
0.0/ 100
METRIC RATING
286th/ 347
METRIC RANK
12.9%
SENIORS POVERTY OVER THE AGE OF 75
5.9/ 100
METRIC RATING
214th/ 347
METRIC RANK
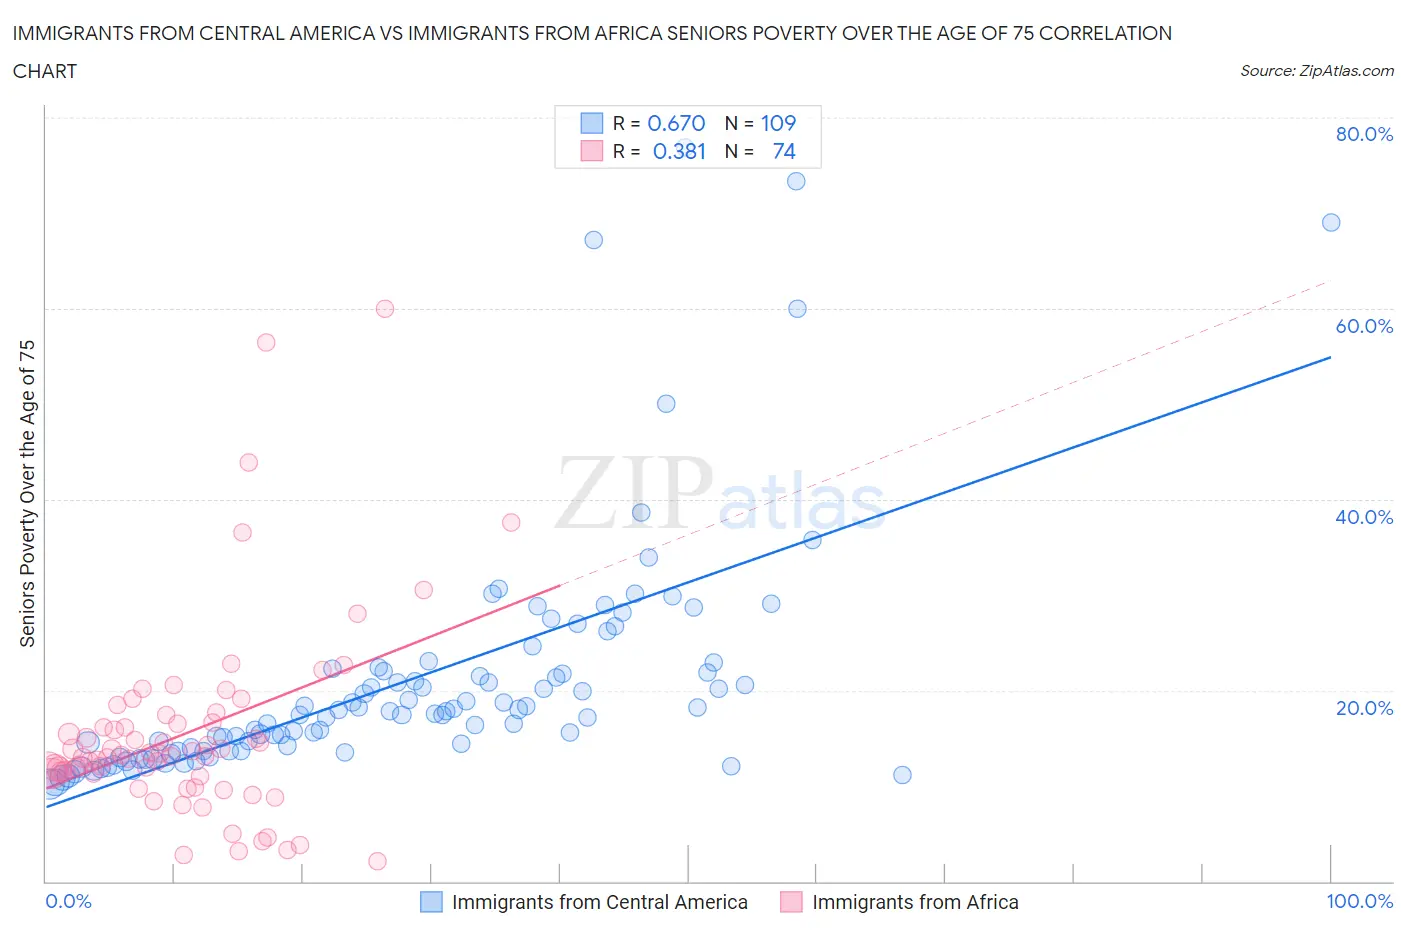
Immigrants from Central America vs Immigrants from Africa Seniors Poverty Over the Age of 75 Correlation Chart
The statistical analysis conducted on geographies consisting of 524,281,293 people shows a significant positive correlation between the proportion of Immigrants from Central America and poverty level among seniors over the age of 75 in the United States with a correlation coefficient (R) of 0.670 and weighted average of 15.0%. Similarly, the statistical analysis conducted on geographies consisting of 462,068,904 people shows a mild positive correlation between the proportion of Immigrants from Africa and poverty level among seniors over the age of 75 in the United States with a correlation coefficient (R) of 0.381 and weighted average of 12.9%, a difference of 16.2%.
Seniors Poverty Over the Age of 75 Correlation Summary
| Measurement | Immigrants from Central America | Immigrants from Africa |
| Minimum | 10.2% | 2.1% |
| Maximum | 76.9% | 60.0% |
| Range | 66.7% | 57.9% |
| Mean | 21.1% | 15.5% |
| Median | 17.8% | 13.2% |
| Interquartile 25% (IQ1) | 13.6% | 11.3% |
| Interquartile 75% (IQ3) | 22.1% | 16.7% |
| Interquartile Range (IQR) | 8.5% | 5.4% |
| Standard Deviation (Sample) | 12.6% | 10.4% |
| Standard Deviation (Population) | 12.5% | 10.3% |
Similar Demographics by Seniors Poverty Over the Age of 75
Demographics Similar to Immigrants from Central America by Seniors Poverty Over the Age of 75
In terms of seniors poverty over the age of 75, the demographic groups most similar to Immigrants from Central America are Immigrants from Mexico (14.9%, a difference of 0.33%), Cheyenne (14.9%, a difference of 0.53%), Immigrants from Guatemala (15.1%, a difference of 0.59%), Guatemalan (14.8%, a difference of 1.2%), and Jamaican (15.1%, a difference of 1.2%).
| Demographics | Rating | Rank | Seniors Poverty Over the Age of 75 |
| Blacks/African Americans | 0.0 /100 | #279 | Tragic 14.6% |
| Central Americans | 0.0 /100 | #280 | Tragic 14.7% |
| Belizeans | 0.0 /100 | #281 | Tragic 14.8% |
| Immigrants | Senegal | 0.0 /100 | #282 | Tragic 14.8% |
| Guatemalans | 0.0 /100 | #283 | Tragic 14.8% |
| Cheyenne | 0.0 /100 | #284 | Tragic 14.9% |
| Immigrants | Mexico | 0.0 /100 | #285 | Tragic 14.9% |
| Immigrants | Central America | 0.0 /100 | #286 | Tragic 15.0% |
| Immigrants | Guatemala | 0.0 /100 | #287 | Tragic 15.1% |
| Jamaicans | 0.0 /100 | #288 | Tragic 15.1% |
| Immigrants | Belize | 0.0 /100 | #289 | Tragic 15.2% |
| Immigrants | Azores | 0.0 /100 | #290 | Tragic 15.2% |
| Paiute | 0.0 /100 | #291 | Tragic 15.2% |
| Colville | 0.0 /100 | #292 | Tragic 15.2% |
| Apache | 0.0 /100 | #293 | Tragic 15.3% |
Demographics Similar to Immigrants from Africa by Seniors Poverty Over the Age of 75
In terms of seniors poverty over the age of 75, the demographic groups most similar to Immigrants from Africa are French American Indian (12.9%, a difference of 0.070%), South American Indian (12.9%, a difference of 0.14%), Immigrants from Hong Kong (12.8%, a difference of 0.22%), Immigrants from Brazil (12.9%, a difference of 0.26%), and Brazilian (12.8%, a difference of 0.35%).
| Demographics | Rating | Rank | Seniors Poverty Over the Age of 75 |
| Costa Ricans | 8.7 /100 | #207 | Tragic 12.8% |
| Immigrants | Eastern Asia | 8.4 /100 | #208 | Tragic 12.8% |
| Immigrants | Liberia | 7.3 /100 | #209 | Tragic 12.8% |
| Comanche | 7.0 /100 | #210 | Tragic 12.8% |
| Brazilians | 6.9 /100 | #211 | Tragic 12.8% |
| Immigrants | Hong Kong | 6.5 /100 | #212 | Tragic 12.8% |
| French American Indians | 6.1 /100 | #213 | Tragic 12.9% |
| Immigrants | Africa | 5.9 /100 | #214 | Tragic 12.9% |
| South American Indians | 5.5 /100 | #215 | Tragic 12.9% |
| Immigrants | Brazil | 5.2 /100 | #216 | Tragic 12.9% |
| Bermudans | 4.9 /100 | #217 | Tragic 12.9% |
| Immigrants | Western Asia | 4.9 /100 | #218 | Tragic 12.9% |
| Ute | 4.7 /100 | #219 | Tragic 12.9% |
| Seminole | 4.5 /100 | #220 | Tragic 12.9% |
| Immigrants | Kazakhstan | 4.3 /100 | #221 | Tragic 13.0% |