Immigrants from Cambodia vs Moroccan Single Male Poverty
COMPARE
Immigrants from Cambodia
Moroccan
Single Male Poverty
Single Male Poverty Comparison
Immigrants from Cambodia
Moroccans
12.7%
SINGLE MALE POVERTY
62.2/ 100
METRIC RATING
165th/ 347
METRIC RANK
12.9%
SINGLE MALE POVERTY
36.8/ 100
METRIC RATING
182nd/ 347
METRIC RANK
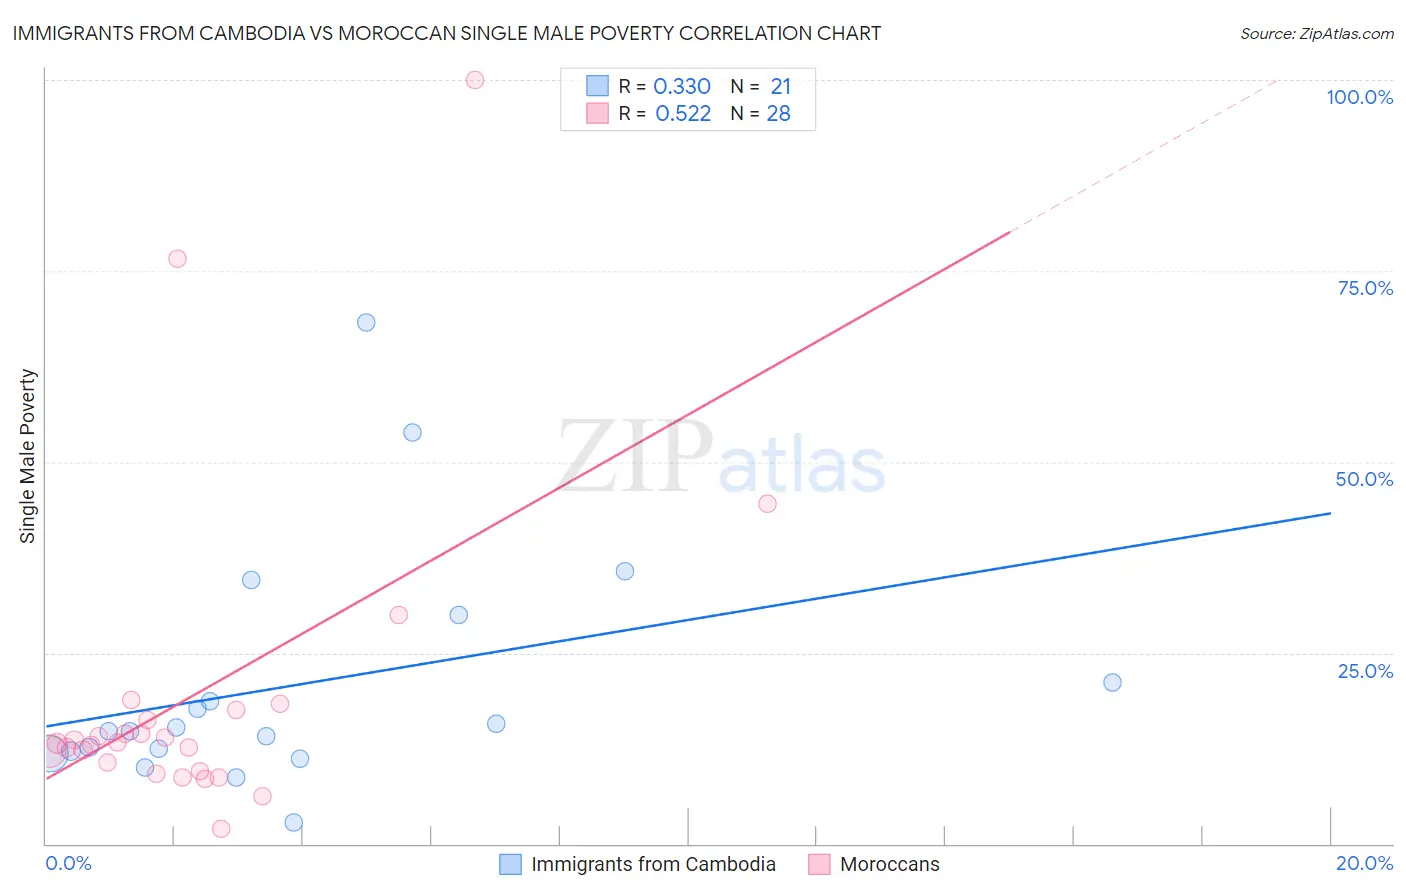
Immigrants from Cambodia vs Moroccan Single Male Poverty Correlation Chart
The statistical analysis conducted on geographies consisting of 192,829,450 people shows a mild positive correlation between the proportion of Immigrants from Cambodia and poverty level among single males in the United States with a correlation coefficient (R) of 0.330 and weighted average of 12.7%. Similarly, the statistical analysis conducted on geographies consisting of 188,123,639 people shows a substantial positive correlation between the proportion of Moroccans and poverty level among single males in the United States with a correlation coefficient (R) of 0.522 and weighted average of 12.9%, a difference of 1.4%.
Single Male Poverty Correlation Summary
| Measurement | Immigrants from Cambodia | Moroccan |
| Minimum | 2.9% | 1.9% |
| Maximum | 68.3% | 100.0% |
| Range | 65.4% | 98.1% |
| Mean | 20.7% | 19.4% |
| Median | 14.8% | 13.2% |
| Interquartile 25% (IQ1) | 11.9% | 10.0% |
| Interquartile 75% (IQ3) | 25.5% | 16.9% |
| Interquartile Range (IQR) | 13.6% | 6.9% |
| Standard Deviation (Sample) | 15.8% | 21.2% |
| Standard Deviation (Population) | 15.4% | 20.8% |
Demographics Similar to Immigrants from Cambodia and Moroccans by Single Male Poverty
In terms of single male poverty, the demographic groups most similar to Immigrants from Cambodia are Immigrants from Nigeria (12.7%, a difference of 0.040%), Palestinian (12.7%, a difference of 0.050%), Immigrants from Guyana (12.7%, a difference of 0.090%), Immigrants from Sudan (12.7%, a difference of 0.22%), and Immigrants from Barbados (12.7%, a difference of 0.25%). Similarly, the demographic groups most similar to Moroccans are Panamanian (12.9%, a difference of 0.040%), Immigrants from North America (12.9%, a difference of 0.050%), Immigrants from West Indies (12.9%, a difference of 0.22%), Israeli (12.9%, a difference of 0.23%), and Immigrants from Switzerland (12.8%, a difference of 0.34%).
| Demographics | Rating | Rank | Single Male Poverty |
| Palestinians | 63.1 /100 | #163 | Good 12.7% |
| Immigrants | Nigeria | 62.8 /100 | #164 | Good 12.7% |
| Immigrants | Cambodia | 62.2 /100 | #165 | Good 12.7% |
| Immigrants | Guyana | 60.5 /100 | #166 | Good 12.7% |
| Immigrants | Sudan | 58.2 /100 | #167 | Average 12.7% |
| Immigrants | Barbados | 57.7 /100 | #168 | Average 12.7% |
| Puget Sound Salish | 54.3 /100 | #169 | Average 12.8% |
| Guyanese | 52.0 /100 | #170 | Average 12.8% |
| South Africans | 51.5 /100 | #171 | Average 12.8% |
| Danes | 51.4 /100 | #172 | Average 12.8% |
| Immigrants | St. Vincent and the Grenadines | 50.9 /100 | #173 | Average 12.8% |
| Costa Ricans | 50.0 /100 | #174 | Average 12.8% |
| Croatians | 48.9 /100 | #175 | Average 12.8% |
| Syrians | 48.4 /100 | #176 | Average 12.8% |
| Immigrants | Canada | 44.8 /100 | #177 | Average 12.8% |
| Immigrants | Switzerland | 43.1 /100 | #178 | Average 12.8% |
| Israelis | 41.0 /100 | #179 | Average 12.9% |
| Immigrants | North America | 37.7 /100 | #180 | Fair 12.9% |
| Panamanians | 37.6 /100 | #181 | Fair 12.9% |
| Moroccans | 36.8 /100 | #182 | Fair 12.9% |
| Immigrants | West Indies | 33.0 /100 | #183 | Fair 12.9% |