Immigrants from Cambodia vs Immigrants from Southern Europe Single Mother Poverty
COMPARE
Immigrants from Cambodia
Immigrants from Southern Europe
Single Mother Poverty
Single Mother Poverty Comparison
Immigrants from Cambodia
Immigrants from Southern Europe
28.9%
SINGLE MOTHER POVERTY
66.6/ 100
METRIC RATING
161st/ 347
METRIC RANK
28.4%
SINGLE MOTHER POVERTY
89.2/ 100
METRIC RATING
134th/ 347
METRIC RANK
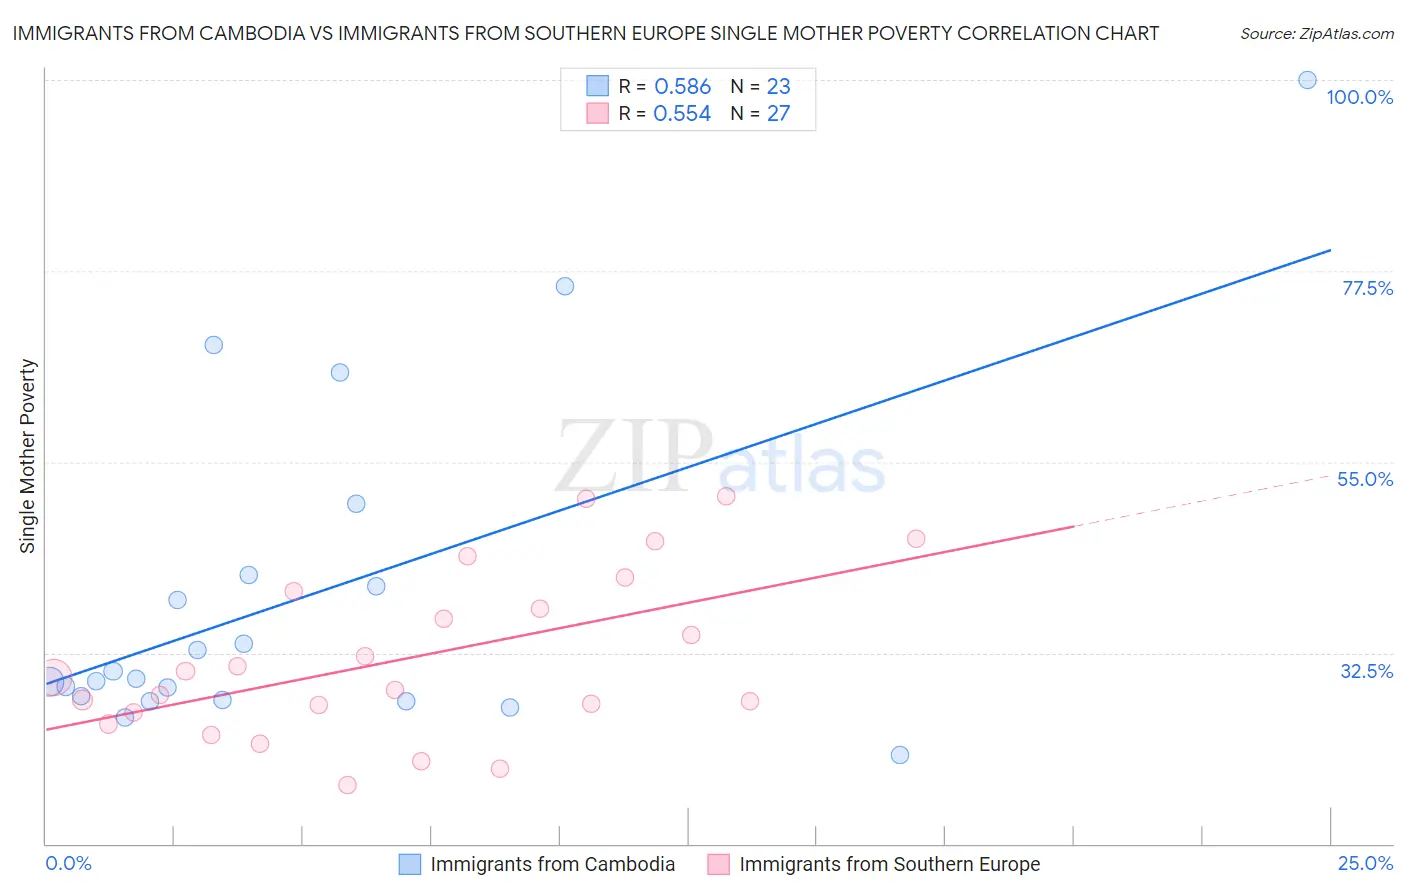
Immigrants from Cambodia vs Immigrants from Southern Europe Single Mother Poverty Correlation Chart
The statistical analysis conducted on geographies consisting of 203,469,130 people shows a substantial positive correlation between the proportion of Immigrants from Cambodia and poverty level among single mothers in the United States with a correlation coefficient (R) of 0.586 and weighted average of 28.9%. Similarly, the statistical analysis conducted on geographies consisting of 390,469,443 people shows a substantial positive correlation between the proportion of Immigrants from Southern Europe and poverty level among single mothers in the United States with a correlation coefficient (R) of 0.554 and weighted average of 28.4%, a difference of 1.8%.
Single Mother Poverty Correlation Summary
| Measurement | Immigrants from Cambodia | Immigrants from Southern Europe |
| Minimum | 20.4% | 16.9% |
| Maximum | 100.0% | 50.9% |
| Range | 79.6% | 34.0% |
| Mean | 39.2% | 31.9% |
| Median | 29.5% | 29.6% |
| Interquartile 25% (IQ1) | 27.0% | 25.4% |
| Interquartile 75% (IQ3) | 41.7% | 39.8% |
| Interquartile Range (IQR) | 14.7% | 14.3% |
| Standard Deviation (Sample) | 19.9% | 9.7% |
| Standard Deviation (Population) | 19.5% | 9.5% |
Similar Demographics by Single Mother Poverty
Demographics Similar to Immigrants from Cambodia by Single Mother Poverty
In terms of single mother poverty, the demographic groups most similar to Immigrants from Cambodia are Scandinavian (28.9%, a difference of 0.020%), Immigrants from Nigeria (28.9%, a difference of 0.040%), Immigrants from Kenya (28.9%, a difference of 0.040%), Japanese (28.9%, a difference of 0.080%), and Czech (28.9%, a difference of 0.10%).
| Demographics | Rating | Rank | Single Mother Poverty |
| Portuguese | 73.2 /100 | #154 | Good 28.8% |
| Ugandans | 71.7 /100 | #155 | Good 28.8% |
| Iraqis | 71.5 /100 | #156 | Good 28.8% |
| Immigrants | Western Europe | 71.1 /100 | #157 | Good 28.9% |
| Immigrants | Hungary | 70.6 /100 | #158 | Good 28.9% |
| Czechs | 68.4 /100 | #159 | Good 28.9% |
| Japanese | 68.0 /100 | #160 | Good 28.9% |
| Immigrants | Cambodia | 66.6 /100 | #161 | Good 28.9% |
| Scandinavians | 66.2 /100 | #162 | Good 28.9% |
| Immigrants | Nigeria | 65.9 /100 | #163 | Good 28.9% |
| Immigrants | Kenya | 65.9 /100 | #164 | Good 28.9% |
| Arabs | 60.7 /100 | #165 | Good 29.0% |
| Inupiat | 60.4 /100 | #166 | Good 29.0% |
| Costa Ricans | 58.4 /100 | #167 | Average 29.0% |
| Europeans | 57.6 /100 | #168 | Average 29.1% |
Demographics Similar to Immigrants from Southern Europe by Single Mother Poverty
In terms of single mother poverty, the demographic groups most similar to Immigrants from Southern Europe are Immigrants from Spain (28.4%, a difference of 0.0%), Immigrants from Morocco (28.4%, a difference of 0.030%), Swedish (28.4%, a difference of 0.030%), Native Hawaiian (28.4%, a difference of 0.040%), and Immigrants from Canada (28.4%, a difference of 0.040%).
| Demographics | Rating | Rank | Single Mother Poverty |
| Poles | 90.8 /100 | #127 | Exceptional 28.4% |
| Immigrants | England | 90.5 /100 | #128 | Exceptional 28.4% |
| South Americans | 90.4 /100 | #129 | Exceptional 28.4% |
| Norwegians | 90.4 /100 | #130 | Exceptional 28.4% |
| Immigrants | Austria | 90.3 /100 | #131 | Exceptional 28.4% |
| Immigrants | Morocco | 89.5 /100 | #132 | Excellent 28.4% |
| Swedes | 89.4 /100 | #133 | Excellent 28.4% |
| Immigrants | Southern Europe | 89.2 /100 | #134 | Excellent 28.4% |
| Immigrants | Spain | 89.2 /100 | #135 | Excellent 28.4% |
| Native Hawaiians | 88.9 /100 | #136 | Excellent 28.4% |
| Immigrants | Canada | 88.9 /100 | #137 | Excellent 28.4% |
| Immigrants | Belgium | 88.5 /100 | #138 | Excellent 28.5% |
| Samoans | 88.1 /100 | #139 | Excellent 28.5% |
| Immigrants | Colombia | 88.0 /100 | #140 | Excellent 28.5% |
| Danes | 87.1 /100 | #141 | Excellent 28.5% |