Immigrants from Cambodia vs Immigrants from Eritrea Child Poverty Under the Age of 16
COMPARE
Immigrants from Cambodia
Immigrants from Eritrea
Child Poverty Under the Age of 16
Child Poverty Under the Age of 16 Comparison
Immigrants from Cambodia
Immigrants from Eritrea
17.8%
CHILD POVERTY UNDER THE AGE OF 16
3.3/ 100
METRIC RATING
223rd/ 347
METRIC RANK
18.5%
CHILD POVERTY UNDER THE AGE OF 16
0.8/ 100
METRIC RATING
238th/ 347
METRIC RANK
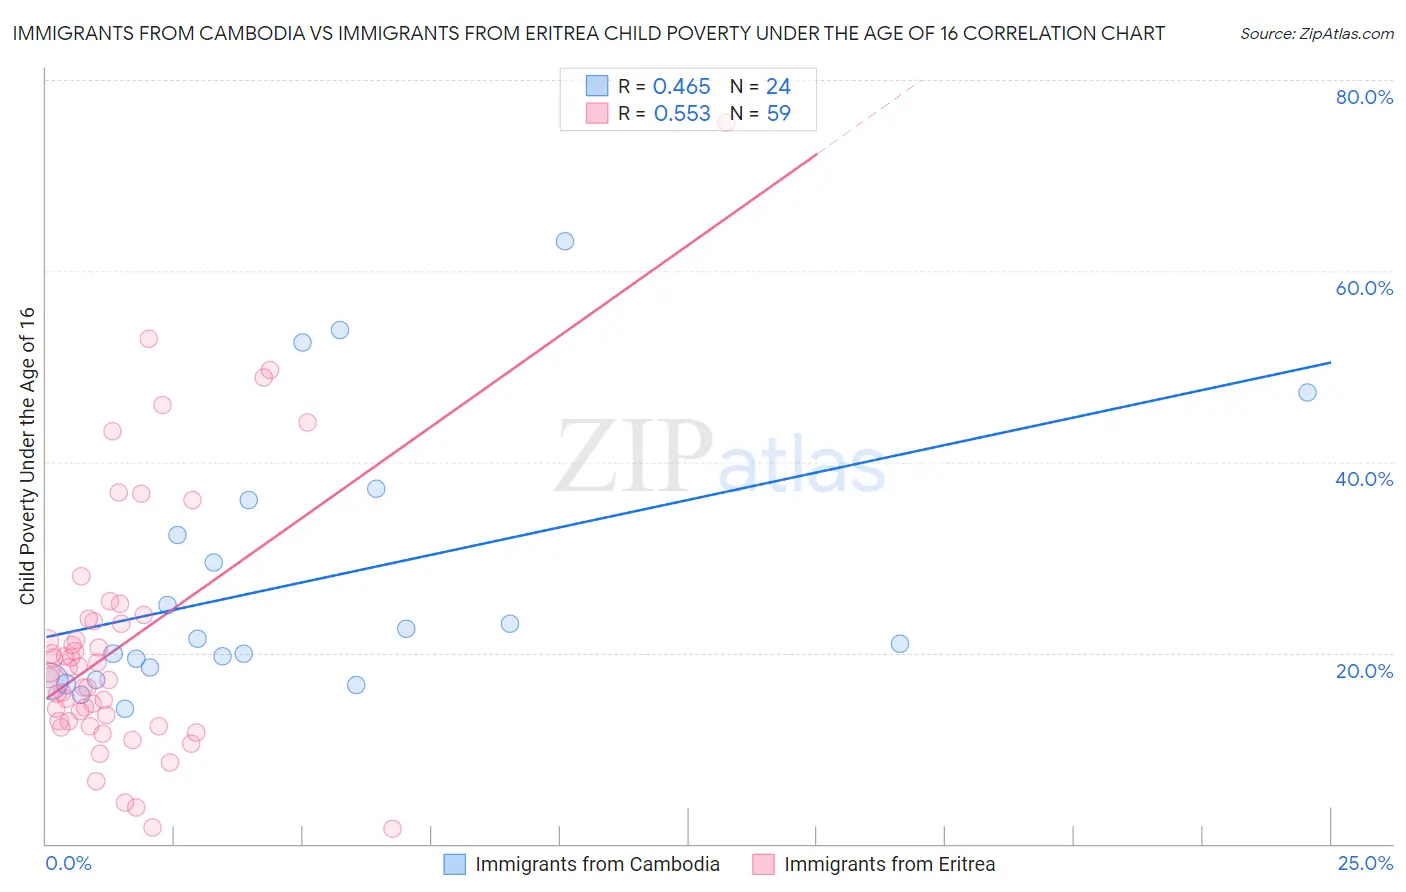
Immigrants from Cambodia vs Immigrants from Eritrea Child Poverty Under the Age of 16 Correlation Chart
The statistical analysis conducted on geographies consisting of 204,722,990 people shows a moderate positive correlation between the proportion of Immigrants from Cambodia and poverty level among children under the age of 16 in the United States with a correlation coefficient (R) of 0.465 and weighted average of 17.8%. Similarly, the statistical analysis conducted on geographies consisting of 104,763,479 people shows a substantial positive correlation between the proportion of Immigrants from Eritrea and poverty level among children under the age of 16 in the United States with a correlation coefficient (R) of 0.553 and weighted average of 18.5%, a difference of 3.9%.
Child Poverty Under the Age of 16 Correlation Summary
| Measurement | Immigrants from Cambodia | Immigrants from Eritrea |
| Minimum | 14.1% | 1.6% |
| Maximum | 63.1% | 75.6% |
| Range | 48.9% | 74.0% |
| Mean | 27.5% | 21.0% |
| Median | 21.2% | 18.0% |
| Interquartile 25% (IQ1) | 17.8% | 12.8% |
| Interquartile 75% (IQ3) | 34.2% | 23.5% |
| Interquartile Range (IQR) | 16.4% | 10.7% |
| Standard Deviation (Sample) | 13.8% | 13.9% |
| Standard Deviation (Population) | 13.5% | 13.7% |
Demographics Similar to Immigrants from Cambodia and Immigrants from Eritrea by Child Poverty Under the Age of 16
In terms of child poverty under the age of 16, the demographic groups most similar to Immigrants from Cambodia are Immigrants from Armenia (17.8%, a difference of 0.24%), Osage (17.9%, a difference of 0.24%), Cuban (17.8%, a difference of 0.30%), Immigrants from Panama (17.7%, a difference of 0.57%), and Nonimmigrants (17.9%, a difference of 0.60%). Similarly, the demographic groups most similar to Immigrants from Eritrea are Immigrants from Sudan (18.5%, a difference of 0.040%), Ghanaian (18.6%, a difference of 0.080%), Sudanese (18.5%, a difference of 0.24%), Cree (18.5%, a difference of 0.27%), and Nigerian (18.4%, a difference of 0.56%).
| Demographics | Rating | Rank | Child Poverty Under the Age of 16 |
| Immigrants | Panama | 4.1 /100 | #220 | Tragic 17.7% |
| Cubans | 3.7 /100 | #221 | Tragic 17.8% |
| Immigrants | Armenia | 3.6 /100 | #222 | Tragic 17.8% |
| Immigrants | Cambodia | 3.3 /100 | #223 | Tragic 17.8% |
| Osage | 3.1 /100 | #224 | Tragic 17.9% |
| Immigrants | Nonimmigrants | 2.7 /100 | #225 | Tragic 17.9% |
| Bermudans | 2.6 /100 | #226 | Tragic 18.0% |
| Immigrants | Africa | 2.5 /100 | #227 | Tragic 18.0% |
| Immigrants | Micronesia | 2.3 /100 | #228 | Tragic 18.0% |
| Marshallese | 1.8 /100 | #229 | Tragic 18.1% |
| Nepalese | 1.7 /100 | #230 | Tragic 18.2% |
| Nicaraguans | 1.7 /100 | #231 | Tragic 18.2% |
| Americans | 1.2 /100 | #232 | Tragic 18.3% |
| Fijians | 1.1 /100 | #233 | Tragic 18.4% |
| Immigrants | Nigeria | 1.0 /100 | #234 | Tragic 18.4% |
| Nigerians | 1.0 /100 | #235 | Tragic 18.4% |
| Cree | 0.9 /100 | #236 | Tragic 18.5% |
| Sudanese | 0.9 /100 | #237 | Tragic 18.5% |
| Immigrants | Eritrea | 0.8 /100 | #238 | Tragic 18.5% |
| Immigrants | Sudan | 0.8 /100 | #239 | Tragic 18.5% |
| Ghanaians | 0.8 /100 | #240 | Tragic 18.6% |