Immigrants from Cabo Verde vs Immigrants from Bolivia Family Poverty
COMPARE
Immigrants from Cabo Verde
Immigrants from Bolivia
Family Poverty
Family Poverty Comparison
Immigrants from Cabo Verde
Immigrants from Bolivia
11.6%
FAMILY POVERTY
0.0/ 100
METRIC RATING
293rd/ 347
METRIC RANK
7.7%
FAMILY POVERTY
98.9/ 100
METRIC RATING
49th/ 347
METRIC RANK
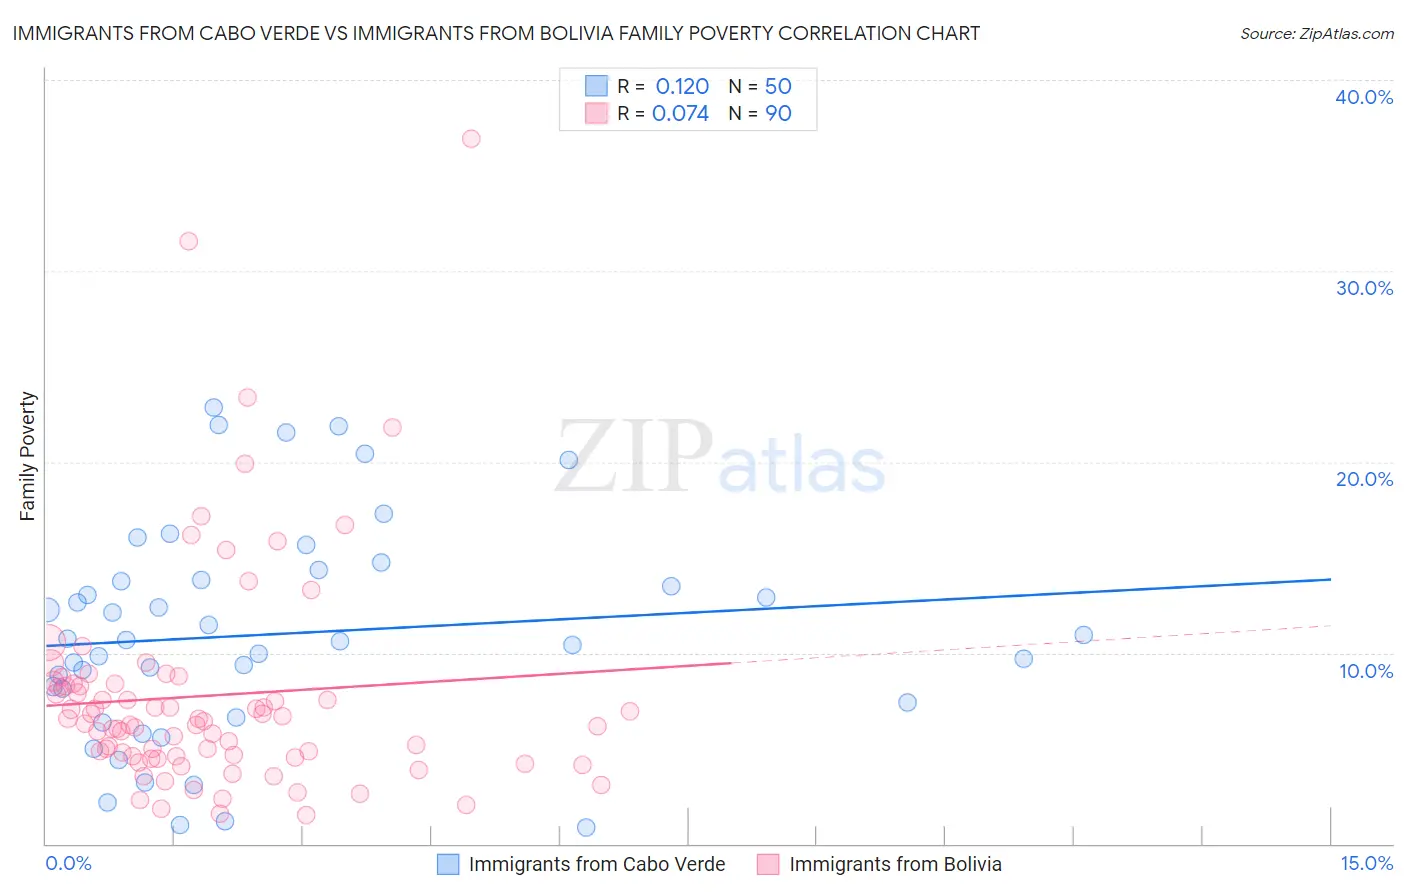
Immigrants from Cabo Verde vs Immigrants from Bolivia Family Poverty Correlation Chart
The statistical analysis conducted on geographies consisting of 38,087,138 people shows a poor positive correlation between the proportion of Immigrants from Cabo Verde and poverty level among families in the United States with a correlation coefficient (R) of 0.120 and weighted average of 11.6%. Similarly, the statistical analysis conducted on geographies consisting of 158,596,723 people shows a slight positive correlation between the proportion of Immigrants from Bolivia and poverty level among families in the United States with a correlation coefficient (R) of 0.074 and weighted average of 7.7%, a difference of 50.9%.
Family Poverty Correlation Summary
| Measurement | Immigrants from Cabo Verde | Immigrants from Bolivia |
| Minimum | 0.86% | 1.5% |
| Maximum | 22.8% | 36.9% |
| Range | 22.0% | 35.4% |
| Mean | 11.0% | 7.8% |
| Median | 10.6% | 6.4% |
| Interquartile 25% (IQ1) | 7.4% | 4.6% |
| Interquartile 75% (IQ3) | 13.8% | 8.4% |
| Interquartile Range (IQR) | 6.4% | 3.8% |
| Standard Deviation (Sample) | 5.7% | 5.9% |
| Standard Deviation (Population) | 5.6% | 5.9% |
Similar Demographics by Family Poverty
Demographics Similar to Immigrants from Cabo Verde by Family Poverty
In terms of family poverty, the demographic groups most similar to Immigrants from Cabo Verde are Immigrants from St. Vincent and the Grenadines (11.6%, a difference of 0.080%), Immigrants from Haiti (11.6%, a difference of 0.20%), Choctaw (11.6%, a difference of 0.25%), Immigrants from Somalia (11.5%, a difference of 0.44%), and Creek (11.7%, a difference of 0.49%).
| Demographics | Rating | Rank | Family Poverty |
| Senegalese | 0.0 /100 | #286 | Tragic 11.5% |
| Vietnamese | 0.0 /100 | #287 | Tragic 11.5% |
| Immigrants | Belize | 0.0 /100 | #288 | Tragic 11.5% |
| Immigrants | Barbados | 0.0 /100 | #289 | Tragic 11.5% |
| West Indians | 0.0 /100 | #290 | Tragic 11.5% |
| Haitians | 0.0 /100 | #291 | Tragic 11.5% |
| Immigrants | Somalia | 0.0 /100 | #292 | Tragic 11.5% |
| Immigrants | Cabo Verde | 0.0 /100 | #293 | Tragic 11.6% |
| Immigrants | St. Vincent and the Grenadines | 0.0 /100 | #294 | Tragic 11.6% |
| Immigrants | Haiti | 0.0 /100 | #295 | Tragic 11.6% |
| Choctaw | 0.0 /100 | #296 | Tragic 11.6% |
| Creek | 0.0 /100 | #297 | Tragic 11.7% |
| Immigrants | Senegal | 0.0 /100 | #298 | Tragic 11.7% |
| Dutch West Indians | 0.0 /100 | #299 | Tragic 11.7% |
| Immigrants | Bangladesh | 0.0 /100 | #300 | Tragic 11.7% |
Demographics Similar to Immigrants from Bolivia by Family Poverty
In terms of family poverty, the demographic groups most similar to Immigrants from Bolivia are Immigrants from North Macedonia (7.7%, a difference of 0.030%), Immigrants from Moldova (7.7%, a difference of 0.18%), Immigrants from Sri Lanka (7.7%, a difference of 0.19%), Immigrants from Czechoslovakia (7.7%, a difference of 0.20%), and Tongan (7.7%, a difference of 0.22%).
| Demographics | Rating | Rank | Family Poverty |
| Scandinavians | 99.1 /100 | #42 | Exceptional 7.6% |
| Immigrants | Austria | 99.1 /100 | #43 | Exceptional 7.6% |
| Germans | 99.0 /100 | #44 | Exceptional 7.7% |
| Okinawans | 98.9 /100 | #45 | Exceptional 7.7% |
| Tongans | 98.9 /100 | #46 | Exceptional 7.7% |
| Immigrants | Czechoslovakia | 98.9 /100 | #47 | Exceptional 7.7% |
| Immigrants | Sri Lanka | 98.9 /100 | #48 | Exceptional 7.7% |
| Immigrants | Bolivia | 98.9 /100 | #49 | Exceptional 7.7% |
| Immigrants | North Macedonia | 98.9 /100 | #50 | Exceptional 7.7% |
| Immigrants | Moldova | 98.8 /100 | #51 | Exceptional 7.7% |
| Indians (Asian) | 98.8 /100 | #52 | Exceptional 7.7% |
| Swiss | 98.8 /100 | #53 | Exceptional 7.7% |
| Immigrants | Sweden | 98.8 /100 | #54 | Exceptional 7.7% |
| Immigrants | Eastern Asia | 98.7 /100 | #55 | Exceptional 7.7% |
| Immigrants | Serbia | 98.7 /100 | #56 | Exceptional 7.7% |