Immigrants from Belgium vs Immigrants from Indonesia Child Poverty Under the Age of 5
COMPARE
Immigrants from Belgium
Immigrants from Indonesia
Child Poverty Under the Age of 5
Child Poverty Under the Age of 5 Comparison
Immigrants from Belgium
Immigrants from Indonesia
15.3%
CHILD POVERTY UNDER THE AGE OF 5
98.8/ 100
METRIC RATING
70th/ 347
METRIC RANK
14.3%
CHILD POVERTY UNDER THE AGE OF 5
99.8/ 100
METRIC RATING
28th/ 347
METRIC RANK
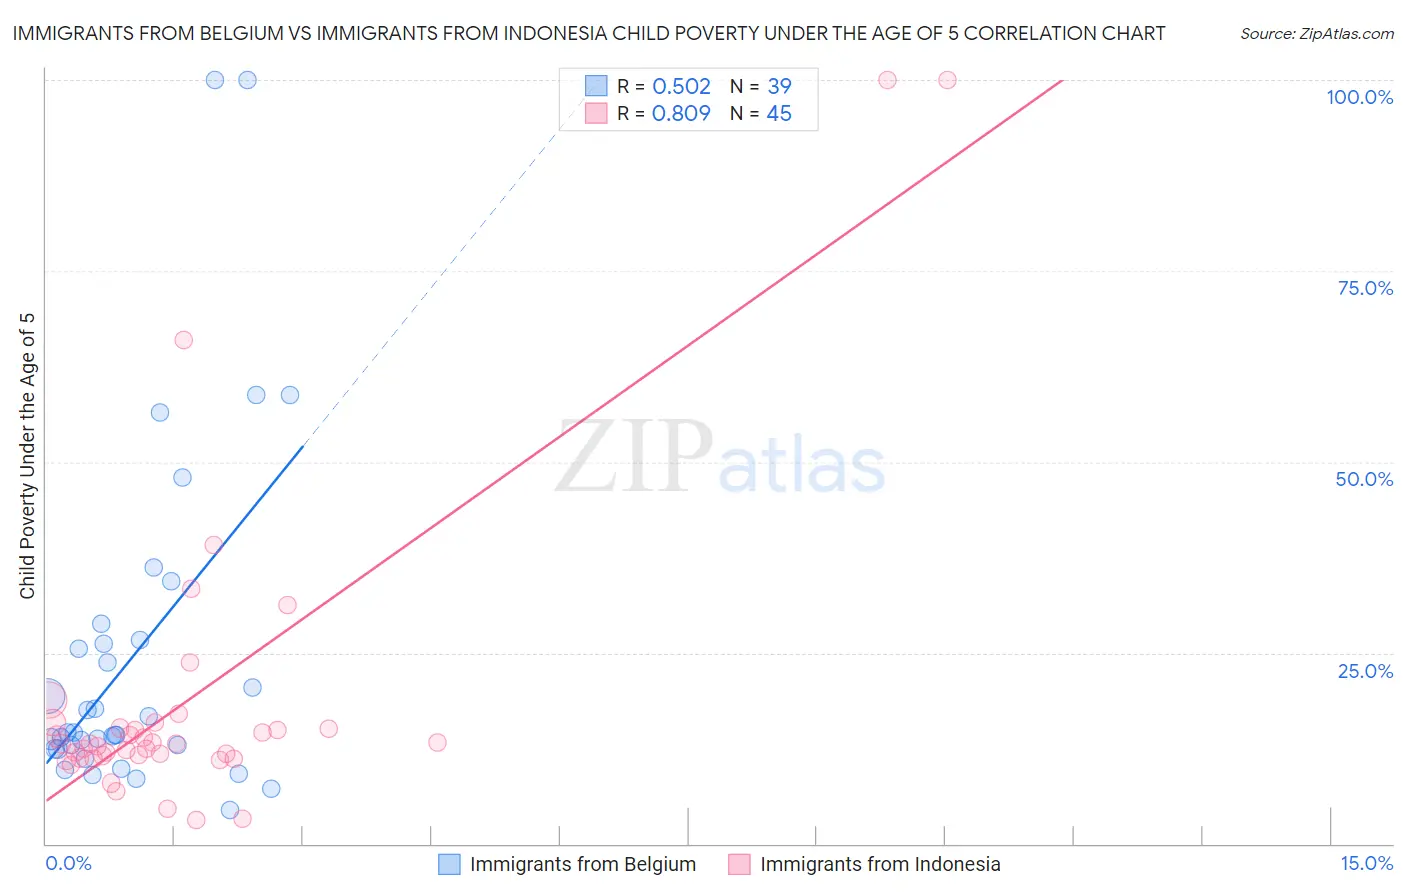
Immigrants from Belgium vs Immigrants from Indonesia Child Poverty Under the Age of 5 Correlation Chart
The statistical analysis conducted on geographies consisting of 142,468,975 people shows a substantial positive correlation between the proportion of Immigrants from Belgium and poverty level among children under the age of 5 in the United States with a correlation coefficient (R) of 0.502 and weighted average of 15.3%. Similarly, the statistical analysis conducted on geographies consisting of 210,678,212 people shows a very strong positive correlation between the proportion of Immigrants from Indonesia and poverty level among children under the age of 5 in the United States with a correlation coefficient (R) of 0.809 and weighted average of 14.3%, a difference of 6.4%.
Child Poverty Under the Age of 5 Correlation Summary
| Measurement | Immigrants from Belgium | Immigrants from Indonesia |
| Minimum | 4.3% | 3.0% |
| Maximum | 100.0% | 100.0% |
| Range | 95.7% | 97.0% |
| Mean | 24.7% | 19.0% |
| Median | 14.5% | 13.0% |
| Interquartile 25% (IQ1) | 12.4% | 11.4% |
| Interquartile 75% (IQ3) | 26.7% | 15.5% |
| Interquartile Range (IQR) | 14.3% | 4.1% |
| Standard Deviation (Sample) | 22.6% | 20.4% |
| Standard Deviation (Population) | 22.3% | 20.2% |
Similar Demographics by Child Poverty Under the Age of 5
Demographics Similar to Immigrants from Belgium by Child Poverty Under the Age of 5
In terms of child poverty under the age of 5, the demographic groups most similar to Immigrants from Belgium are Immigrants from Egypt (15.3%, a difference of 0.0%), Immigrants from Sweden (15.3%, a difference of 0.070%), Immigrants from Ukraine (15.3%, a difference of 0.30%), Lithuanian (15.2%, a difference of 0.43%), and Greek (15.2%, a difference of 0.45%).
| Demographics | Rating | Rank | Child Poverty Under the Age of 5 |
| Immigrants | Europe | 99.1 /100 | #63 | Exceptional 15.1% |
| Immigrants | Romania | 99.1 /100 | #64 | Exceptional 15.2% |
| Immigrants | Fiji | 99.0 /100 | #65 | Exceptional 15.2% |
| Immigrants | Scotland | 99.0 /100 | #66 | Exceptional 15.2% |
| Greeks | 99.0 /100 | #67 | Exceptional 15.2% |
| Zimbabweans | 99.0 /100 | #68 | Exceptional 15.2% |
| Lithuanians | 99.0 /100 | #69 | Exceptional 15.2% |
| Immigrants | Belgium | 98.8 /100 | #70 | Exceptional 15.3% |
| Immigrants | Egypt | 98.8 /100 | #71 | Exceptional 15.3% |
| Immigrants | Sweden | 98.8 /100 | #72 | Exceptional 15.3% |
| Immigrants | Ukraine | 98.7 /100 | #73 | Exceptional 15.3% |
| Argentineans | 98.5 /100 | #74 | Exceptional 15.4% |
| Immigrants | Argentina | 98.5 /100 | #75 | Exceptional 15.4% |
| Croatians | 98.5 /100 | #76 | Exceptional 15.4% |
| Immigrants | Turkey | 98.3 /100 | #77 | Exceptional 15.4% |
Demographics Similar to Immigrants from Indonesia by Child Poverty Under the Age of 5
In terms of child poverty under the age of 5, the demographic groups most similar to Immigrants from Indonesia are Immigrants from Asia (14.4%, a difference of 0.39%), Cambodian (14.4%, a difference of 0.44%), Korean (14.4%, a difference of 0.47%), Immigrants from Sri Lanka (14.4%, a difference of 0.75%), and Taiwanese (14.5%, a difference of 1.1%).
| Demographics | Rating | Rank | Child Poverty Under the Age of 5 |
| Bolivians | 100.0 /100 | #21 | Exceptional 13.8% |
| Immigrants | Bolivia | 100.0 /100 | #22 | Exceptional 13.8% |
| Bulgarians | 99.9 /100 | #23 | Exceptional 13.9% |
| Asians | 99.9 /100 | #24 | Exceptional 14.0% |
| Cypriots | 99.9 /100 | #25 | Exceptional 14.0% |
| Immigrants | Lithuania | 99.9 /100 | #26 | Exceptional 14.1% |
| Tongans | 99.9 /100 | #27 | Exceptional 14.2% |
| Immigrants | Indonesia | 99.8 /100 | #28 | Exceptional 14.3% |
| Immigrants | Asia | 99.8 /100 | #29 | Exceptional 14.4% |
| Cambodians | 99.8 /100 | #30 | Exceptional 14.4% |
| Koreans | 99.8 /100 | #31 | Exceptional 14.4% |
| Immigrants | Sri Lanka | 99.8 /100 | #32 | Exceptional 14.4% |
| Taiwanese | 99.8 /100 | #33 | Exceptional 14.5% |
| Immigrants | Moldova | 99.8 /100 | #34 | Exceptional 14.5% |
| Latvians | 99.8 /100 | #35 | Exceptional 14.5% |