Immigrants from Asia vs Immigrants from Trinidad and Tobago Single Male Poverty
COMPARE
Immigrants from Asia
Immigrants from Trinidad and Tobago
Single Male Poverty
Single Male Poverty Comparison
Immigrants from Asia
Immigrants from Trinidad and Tobago
11.4%
SINGLE MALE POVERTY
100.0/ 100
METRIC RATING
28th/ 347
METRIC RANK
12.9%
SINGLE MALE POVERTY
32.5/ 100
METRIC RATING
184th/ 347
METRIC RANK
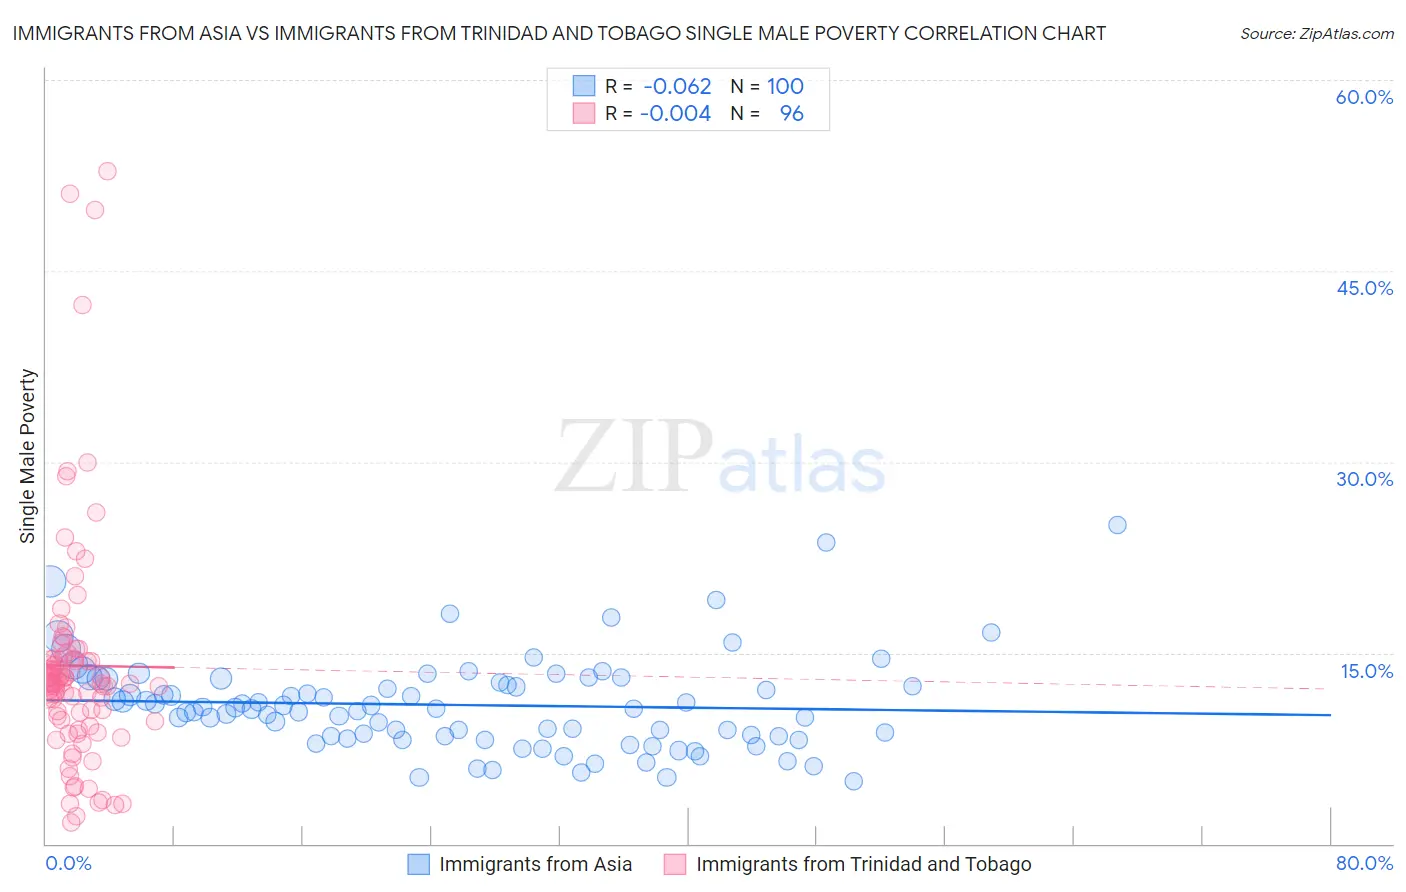
Immigrants from Asia vs Immigrants from Trinidad and Tobago Single Male Poverty Correlation Chart
The statistical analysis conducted on geographies consisting of 461,688,534 people shows a slight negative correlation between the proportion of Immigrants from Asia and poverty level among single males in the United States with a correlation coefficient (R) of -0.062 and weighted average of 11.4%. Similarly, the statistical analysis conducted on geographies consisting of 206,843,036 people shows no correlation between the proportion of Immigrants from Trinidad and Tobago and poverty level among single males in the United States with a correlation coefficient (R) of -0.004 and weighted average of 12.9%, a difference of 13.5%.
Single Male Poverty Correlation Summary
| Measurement | Immigrants from Asia | Immigrants from Trinidad and Tobago |
| Minimum | 4.9% | 1.7% |
| Maximum | 25.0% | 52.8% |
| Range | 20.1% | 51.1% |
| Mean | 10.9% | 14.0% |
| Median | 10.6% | 12.6% |
| Interquartile 25% (IQ1) | 8.4% | 9.7% |
| Interquartile 75% (IQ3) | 12.8% | 14.5% |
| Interquartile Range (IQR) | 4.4% | 4.9% |
| Standard Deviation (Sample) | 3.7% | 9.2% |
| Standard Deviation (Population) | 3.6% | 9.2% |
Similar Demographics by Single Male Poverty
Demographics Similar to Immigrants from Asia by Single Male Poverty
In terms of single male poverty, the demographic groups most similar to Immigrants from Asia are Immigrants from China (11.4%, a difference of 0.070%), Immigrants from Egypt (11.4%, a difference of 0.10%), Iranian (11.4%, a difference of 0.16%), Immigrants from Iran (11.4%, a difference of 0.25%), and Immigrants from Eastern Asia (11.4%, a difference of 0.34%).
| Demographics | Rating | Rank | Single Male Poverty |
| Asians | 100.0 /100 | #21 | Exceptional 11.2% |
| Immigrants | Pakistan | 100.0 /100 | #22 | Exceptional 11.2% |
| Bolivians | 100.0 /100 | #23 | Exceptional 11.2% |
| Indians (Asian) | 100.0 /100 | #24 | Exceptional 11.3% |
| Maltese | 100.0 /100 | #25 | Exceptional 11.3% |
| Immigrants | Japan | 100.0 /100 | #26 | Exceptional 11.3% |
| Immigrants | China | 100.0 /100 | #27 | Exceptional 11.4% |
| Immigrants | Asia | 100.0 /100 | #28 | Exceptional 11.4% |
| Immigrants | Egypt | 100.0 /100 | #29 | Exceptional 11.4% |
| Iranians | 100.0 /100 | #30 | Exceptional 11.4% |
| Immigrants | Iran | 100.0 /100 | #31 | Exceptional 11.4% |
| Immigrants | Eastern Asia | 100.0 /100 | #32 | Exceptional 11.4% |
| Immigrants | Vietnam | 100.0 /100 | #33 | Exceptional 11.4% |
| Immigrants | Ethiopia | 100.0 /100 | #34 | Exceptional 11.4% |
| Immigrants | South Eastern Asia | 100.0 /100 | #35 | Exceptional 11.4% |
Demographics Similar to Immigrants from Trinidad and Tobago by Single Male Poverty
In terms of single male poverty, the demographic groups most similar to Immigrants from Trinidad and Tobago are Immigrants from West Indies (12.9%, a difference of 0.030%), Norwegian (12.9%, a difference of 0.030%), Nigerian (12.9%, a difference of 0.030%), Immigrants from Kuwait (12.9%, a difference of 0.040%), and Macedonian (12.9%, a difference of 0.060%).
| Demographics | Rating | Rank | Single Male Poverty |
| Immigrants | Canada | 44.8 /100 | #177 | Average 12.8% |
| Immigrants | Switzerland | 43.1 /100 | #178 | Average 12.8% |
| Israelis | 41.0 /100 | #179 | Average 12.9% |
| Immigrants | North America | 37.7 /100 | #180 | Fair 12.9% |
| Panamanians | 37.6 /100 | #181 | Fair 12.9% |
| Moroccans | 36.8 /100 | #182 | Fair 12.9% |
| Immigrants | West Indies | 33.0 /100 | #183 | Fair 12.9% |
| Immigrants | Trinidad and Tobago | 32.5 /100 | #184 | Fair 12.9% |
| Norwegians | 32.0 /100 | #185 | Fair 12.9% |
| Nigerians | 31.9 /100 | #186 | Fair 12.9% |
| Immigrants | Kuwait | 31.9 /100 | #187 | Fair 12.9% |
| Macedonians | 31.5 /100 | #188 | Fair 12.9% |
| Portuguese | 30.2 /100 | #189 | Fair 12.9% |
| Arabs | 27.0 /100 | #190 | Fair 13.0% |
| Immigrants | Thailand | 26.6 /100 | #191 | Fair 13.0% |