Immigrants from Armenia vs Basque Female Poverty Among 18-24 Year Olds
COMPARE
Immigrants from Armenia
Basque
Female Poverty Among 18-24 Year Olds
Female Poverty Among 18-24 Year Olds Comparison
Immigrants from Armenia
Basques
18.9%
FEMALE POVERTY AMONG 18-24 YEAR OLDS
99.2/ 100
METRIC RATING
85th/ 347
METRIC RANK
21.7%
FEMALE POVERTY AMONG 18-24 YEAR OLDS
0.2/ 100
METRIC RATING
272nd/ 347
METRIC RANK
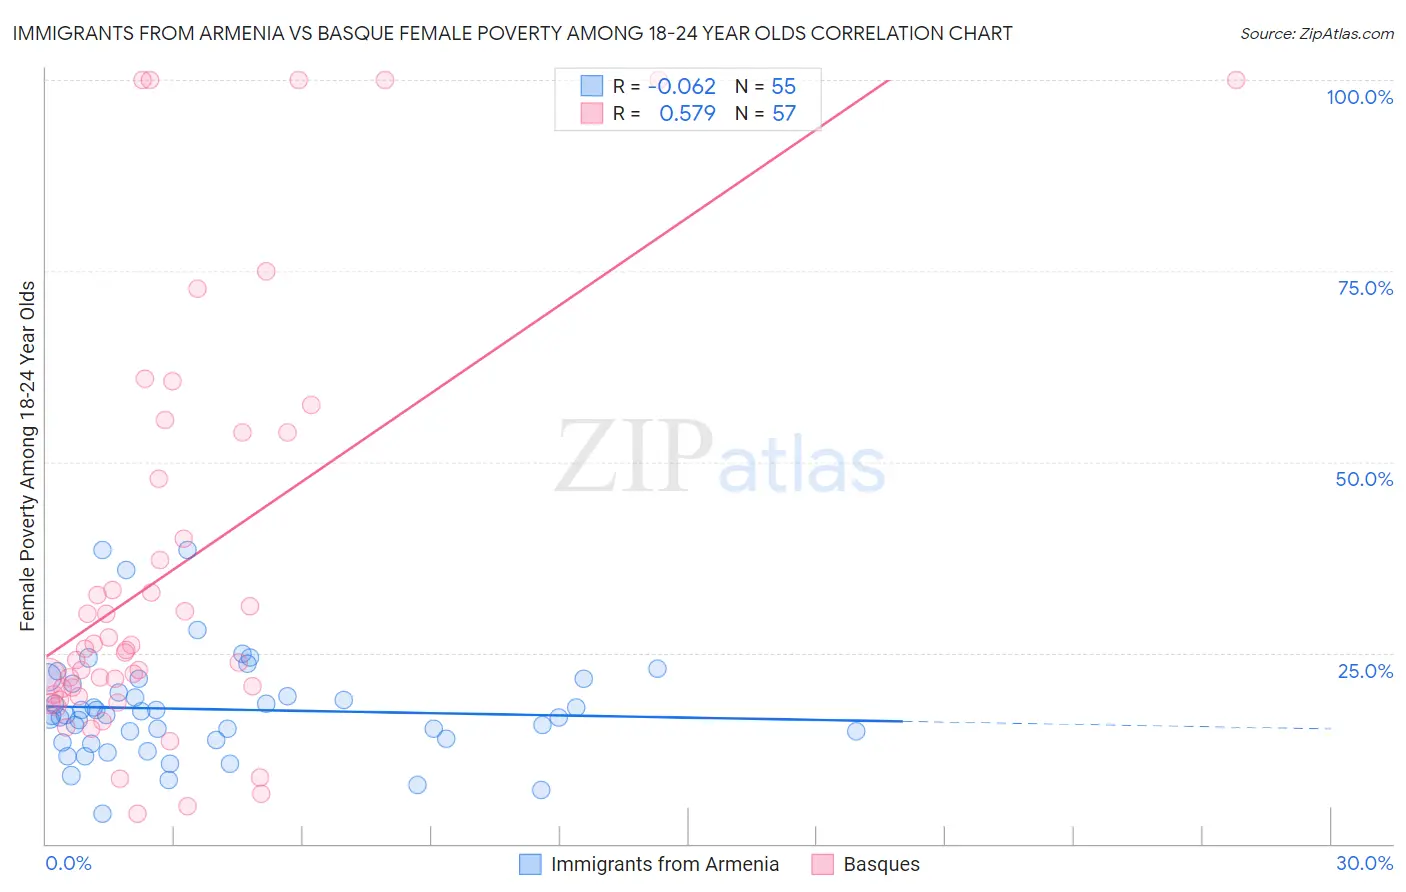
Immigrants from Armenia vs Basque Female Poverty Among 18-24 Year Olds Correlation Chart
The statistical analysis conducted on geographies consisting of 97,121,428 people shows a slight negative correlation between the proportion of Immigrants from Armenia and poverty level among females between the ages 18 and 24 in the United States with a correlation coefficient (R) of -0.062 and weighted average of 18.9%. Similarly, the statistical analysis conducted on geographies consisting of 164,234,087 people shows a substantial positive correlation between the proportion of Basques and poverty level among females between the ages 18 and 24 in the United States with a correlation coefficient (R) of 0.579 and weighted average of 21.7%, a difference of 14.5%.
Female Poverty Among 18-24 Year Olds Correlation Summary
| Measurement | Immigrants from Armenia | Basque |
| Minimum | 4.0% | 4.0% |
| Maximum | 38.5% | 100.0% |
| Range | 34.6% | 96.0% |
| Mean | 17.6% | 36.1% |
| Median | 16.8% | 25.4% |
| Interquartile 25% (IQ1) | 13.6% | 19.4% |
| Interquartile 75% (IQ3) | 20.9% | 50.8% |
| Interquartile Range (IQR) | 7.3% | 31.4% |
| Standard Deviation (Sample) | 6.9% | 27.2% |
| Standard Deviation (Population) | 6.8% | 26.9% |
Similar Demographics by Female Poverty Among 18-24 Year Olds
Demographics Similar to Immigrants from Armenia by Female Poverty Among 18-24 Year Olds
In terms of female poverty among 18-24 year olds, the demographic groups most similar to Immigrants from Armenia are Burmese (18.9%, a difference of 0.030%), Immigrants from Iraq (18.9%, a difference of 0.070%), Immigrants from Jamaica (18.9%, a difference of 0.090%), Croatian (19.0%, a difference of 0.24%), and Immigrants from Cabo Verde (19.0%, a difference of 0.26%).
| Demographics | Rating | Rank | Female Poverty Among 18-24 Year Olds |
| Immigrants | Europe | 99.5 /100 | #78 | Exceptional 18.8% |
| Uruguayans | 99.5 /100 | #79 | Exceptional 18.8% |
| Palestinians | 99.5 /100 | #80 | Exceptional 18.8% |
| Japanese | 99.5 /100 | #81 | Exceptional 18.8% |
| Immigrants | Uruguay | 99.4 /100 | #82 | Exceptional 18.8% |
| Immigrants | Indonesia | 99.4 /100 | #83 | Exceptional 18.9% |
| Burmese | 99.2 /100 | #84 | Exceptional 18.9% |
| Immigrants | Armenia | 99.2 /100 | #85 | Exceptional 18.9% |
| Immigrants | Iraq | 99.2 /100 | #86 | Exceptional 18.9% |
| Immigrants | Jamaica | 99.2 /100 | #87 | Exceptional 18.9% |
| Croatians | 99.1 /100 | #88 | Exceptional 19.0% |
| Immigrants | Cabo Verde | 99.0 /100 | #89 | Exceptional 19.0% |
| Afghans | 99.0 /100 | #90 | Exceptional 19.0% |
| Romanians | 98.9 /100 | #91 | Exceptional 19.0% |
| Filipinos | 98.9 /100 | #92 | Exceptional 19.0% |
Demographics Similar to Basques by Female Poverty Among 18-24 Year Olds
In terms of female poverty among 18-24 year olds, the demographic groups most similar to Basques are New Zealander (21.7%, a difference of 0.14%), Scotch-Irish (21.6%, a difference of 0.27%), Mongolian (21.6%, a difference of 0.29%), Celtic (21.6%, a difference of 0.32%), and Immigrants from Burma/Myanmar (21.6%, a difference of 0.37%).
| Demographics | Rating | Rank | Female Poverty Among 18-24 Year Olds |
| Immigrants | Nonimmigrants | 0.3 /100 | #265 | Tragic 21.5% |
| Alaska Natives | 0.3 /100 | #266 | Tragic 21.5% |
| Americans | 0.3 /100 | #267 | Tragic 21.6% |
| Immigrants | Burma/Myanmar | 0.2 /100 | #268 | Tragic 21.6% |
| Celtics | 0.2 /100 | #269 | Tragic 21.6% |
| Mongolians | 0.2 /100 | #270 | Tragic 21.6% |
| Scotch-Irish | 0.2 /100 | #271 | Tragic 21.6% |
| Basques | 0.2 /100 | #272 | Tragic 21.7% |
| New Zealanders | 0.2 /100 | #273 | Tragic 21.7% |
| Immigrants | Honduras | 0.1 /100 | #274 | Tragic 21.8% |
| Immigrants | Bangladesh | 0.1 /100 | #275 | Tragic 21.8% |
| Bahamians | 0.1 /100 | #276 | Tragic 21.8% |
| Immigrants | Switzerland | 0.1 /100 | #277 | Tragic 21.8% |
| Yaqui | 0.1 /100 | #278 | Tragic 21.9% |
| Spanish Americans | 0.1 /100 | #279 | Tragic 21.9% |