Immigrants from Argentina vs Romanian Child Poverty Under the Age of 16
COMPARE
Immigrants from Argentina
Romanian
Child Poverty Under the Age of 16
Child Poverty Under the Age of 16 Comparison
Immigrants from Argentina
Romanians
14.5%
CHILD POVERTY UNDER THE AGE OF 16
97.1/ 100
METRIC RATING
86th/ 347
METRIC RANK
14.8%
CHILD POVERTY UNDER THE AGE OF 16
95.0/ 100
METRIC RATING
102nd/ 347
METRIC RANK
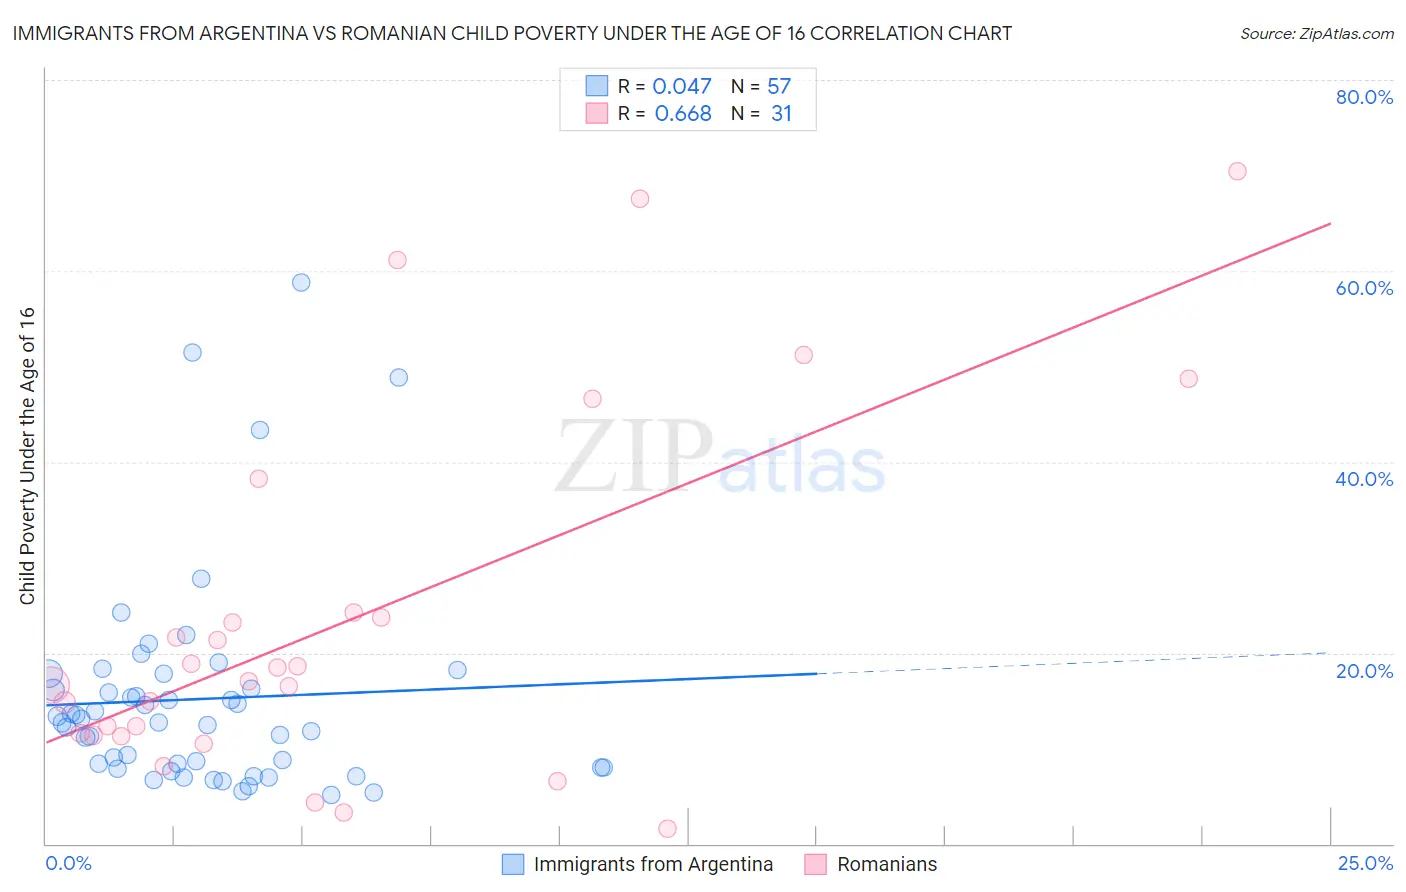
Immigrants from Argentina vs Romanian Child Poverty Under the Age of 16 Correlation Chart
The statistical analysis conducted on geographies consisting of 262,825,580 people shows no correlation between the proportion of Immigrants from Argentina and poverty level among children under the age of 16 in the United States with a correlation coefficient (R) of 0.047 and weighted average of 14.5%. Similarly, the statistical analysis conducted on geographies consisting of 373,993,261 people shows a significant positive correlation between the proportion of Romanians and poverty level among children under the age of 16 in the United States with a correlation coefficient (R) of 0.668 and weighted average of 14.8%, a difference of 1.9%.
Child Poverty Under the Age of 16 Correlation Summary
| Measurement | Immigrants from Argentina | Romanian |
| Minimum | 5.1% | 1.6% |
| Maximum | 58.8% | 70.4% |
| Range | 53.7% | 68.8% |
| Mean | 15.2% | 23.4% |
| Median | 12.8% | 17.0% |
| Interquartile 25% (IQ1) | 8.0% | 11.4% |
| Interquartile 75% (IQ3) | 17.0% | 24.3% |
| Interquartile Range (IQR) | 9.0% | 12.9% |
| Standard Deviation (Sample) | 11.1% | 18.9% |
| Standard Deviation (Population) | 11.0% | 18.6% |
Demographics Similar to Immigrants from Argentina and Romanians by Child Poverty Under the Age of 16
In terms of child poverty under the age of 16, the demographic groups most similar to Immigrants from Argentina are Taiwanese (14.5%, a difference of 0.0%), Soviet Union (14.5%, a difference of 0.080%), Immigrants from Latvia (14.5%, a difference of 0.10%), Northern European (14.5%, a difference of 0.10%), and German (14.5%, a difference of 0.16%). Similarly, the demographic groups most similar to Romanians are Immigrants from Egypt (14.8%, a difference of 0.050%), Immigrants from Switzerland (14.8%, a difference of 0.070%), Dutch (14.8%, a difference of 0.080%), Immigrants from England (14.8%, a difference of 0.090%), and British (14.7%, a difference of 0.40%).
| Demographics | Rating | Rank | Child Poverty Under the Age of 16 |
| Immigrants | Latvia | 97.1 /100 | #84 | Exceptional 14.5% |
| Soviet Union | 97.1 /100 | #85 | Exceptional 14.5% |
| Immigrants | Argentina | 97.1 /100 | #86 | Exceptional 14.5% |
| Taiwanese | 97.1 /100 | #87 | Exceptional 14.5% |
| Northern Europeans | 97.0 /100 | #88 | Exceptional 14.5% |
| Germans | 96.9 /100 | #89 | Exceptional 14.5% |
| Austrians | 96.9 /100 | #90 | Exceptional 14.5% |
| Immigrants | North America | 96.7 /100 | #91 | Exceptional 14.6% |
| Immigrants | Italy | 96.7 /100 | #92 | Exceptional 14.6% |
| Argentineans | 96.6 /100 | #93 | Exceptional 14.6% |
| Immigrants | South Africa | 96.3 /100 | #94 | Exceptional 14.6% |
| Immigrants | Croatia | 96.1 /100 | #95 | Exceptional 14.6% |
| Immigrants | France | 95.8 /100 | #96 | Exceptional 14.7% |
| Paraguayans | 95.7 /100 | #97 | Exceptional 14.7% |
| Immigrants | Belarus | 95.7 /100 | #98 | Exceptional 14.7% |
| British | 95.5 /100 | #99 | Exceptional 14.7% |
| Dutch | 95.1 /100 | #100 | Exceptional 14.8% |
| Immigrants | Switzerland | 95.1 /100 | #101 | Exceptional 14.8% |
| Romanians | 95.0 /100 | #102 | Exceptional 14.8% |
| Immigrants | Egypt | 94.9 /100 | #103 | Exceptional 14.8% |
| Immigrants | England | 94.8 /100 | #104 | Exceptional 14.8% |