Hispanic or Latino vs Immigrants from Ukraine Female Poverty Among 25-34 Year Olds
COMPARE
Hispanic or Latino
Immigrants from Ukraine
Female Poverty Among 25-34 Year Olds
Female Poverty Among 25-34 Year Olds Comparison
Hispanics or Latinos
Immigrants from Ukraine
16.6%
FEMALE POVERTY AMONG 25-34 YEAR OLDS
0.0/ 100
METRIC RATING
296th/ 347
METRIC RANK
12.3%
FEMALE POVERTY AMONG 25-34 YEAR OLDS
98.6/ 100
METRIC RATING
78th/ 347
METRIC RANK
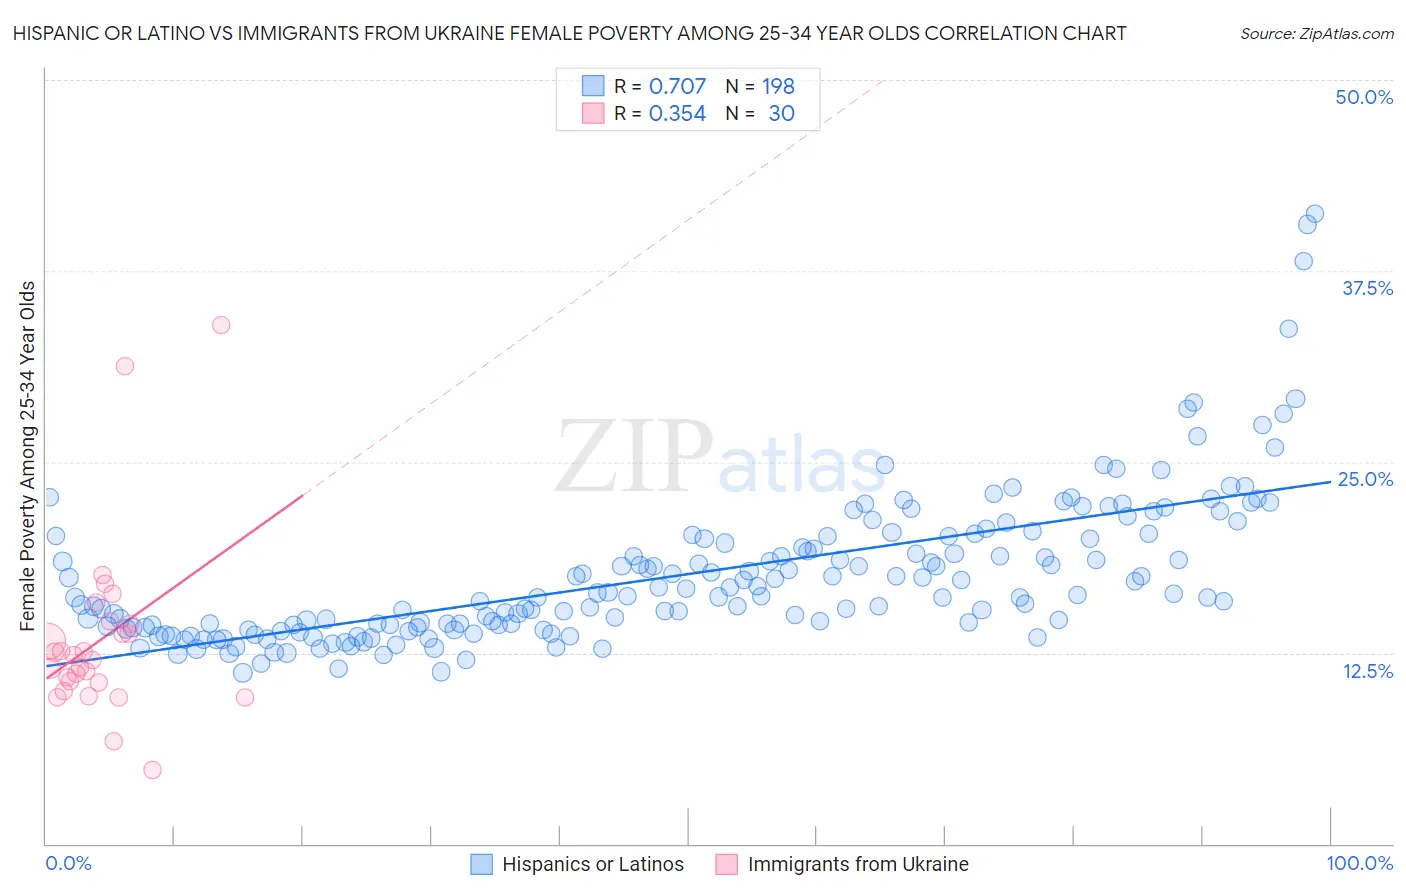
Hispanic or Latino vs Immigrants from Ukraine Female Poverty Among 25-34 Year Olds Correlation Chart
The statistical analysis conducted on geographies consisting of 552,620,217 people shows a strong positive correlation between the proportion of Hispanics or Latinos and poverty level among females between the ages 25 and 34 in the United States with a correlation coefficient (R) of 0.707 and weighted average of 16.6%. Similarly, the statistical analysis conducted on geographies consisting of 285,005,890 people shows a mild positive correlation between the proportion of Immigrants from Ukraine and poverty level among females between the ages 25 and 34 in the United States with a correlation coefficient (R) of 0.354 and weighted average of 12.3%, a difference of 34.8%.
Female Poverty Among 25-34 Year Olds Correlation Summary
| Measurement | Hispanic or Latino | Immigrants from Ukraine |
| Minimum | 11.2% | 4.9% |
| Maximum | 41.3% | 34.0% |
| Range | 30.1% | 29.1% |
| Mean | 17.6% | 13.4% |
| Median | 16.2% | 12.2% |
| Interquartile 25% (IQ1) | 14.2% | 10.6% |
| Interquartile 75% (IQ3) | 19.9% | 14.4% |
| Interquartile Range (IQR) | 5.8% | 3.8% |
| Standard Deviation (Sample) | 4.9% | 5.9% |
| Standard Deviation (Population) | 4.9% | 5.8% |
Similar Demographics by Female Poverty Among 25-34 Year Olds
Demographics Similar to Hispanics or Latinos by Female Poverty Among 25-34 Year Olds
In terms of female poverty among 25-34 year olds, the demographic groups most similar to Hispanics or Latinos are Immigrants from Guatemala (16.6%, a difference of 0.060%), Mexican (16.6%, a difference of 0.20%), Immigrants from Central America (16.6%, a difference of 0.27%), Blackfeet (16.7%, a difference of 0.57%), and Spanish American (16.7%, a difference of 0.61%).
| Demographics | Rating | Rank | Female Poverty Among 25-34 Year Olds |
| Osage | 0.0 /100 | #289 | Tragic 16.4% |
| Indonesians | 0.0 /100 | #290 | Tragic 16.4% |
| Comanche | 0.0 /100 | #291 | Tragic 16.5% |
| Immigrants | Dominica | 0.0 /100 | #292 | Tragic 16.5% |
| Potawatomi | 0.0 /100 | #293 | Tragic 16.5% |
| Immigrants | Central America | 0.0 /100 | #294 | Tragic 16.6% |
| Mexicans | 0.0 /100 | #295 | Tragic 16.6% |
| Hispanics or Latinos | 0.0 /100 | #296 | Tragic 16.6% |
| Immigrants | Guatemala | 0.0 /100 | #297 | Tragic 16.6% |
| Blackfeet | 0.0 /100 | #298 | Tragic 16.7% |
| Spanish Americans | 0.0 /100 | #299 | Tragic 16.7% |
| U.S. Virgin Islanders | 0.0 /100 | #300 | Tragic 16.7% |
| Immigrants | Congo | 0.0 /100 | #301 | Tragic 16.7% |
| Alaska Natives | 0.0 /100 | #302 | Tragic 16.8% |
| Immigrants | Mexico | 0.0 /100 | #303 | Tragic 16.8% |
Demographics Similar to Immigrants from Ukraine by Female Poverty Among 25-34 Year Olds
In terms of female poverty among 25-34 year olds, the demographic groups most similar to Immigrants from Ukraine are Immigrants from Italy (12.3%, a difference of 0.23%), Immigrants from Jordan (12.4%, a difference of 0.27%), Greek (12.3%, a difference of 0.39%), Estonian (12.3%, a difference of 0.45%), and Immigrants from Sweden (12.3%, a difference of 0.50%).
| Demographics | Rating | Rank | Female Poverty Among 25-34 Year Olds |
| Immigrants | Scotland | 99.1 /100 | #71 | Exceptional 12.2% |
| Lithuanians | 99.1 /100 | #72 | Exceptional 12.2% |
| Immigrants | Vietnam | 98.9 /100 | #73 | Exceptional 12.3% |
| Immigrants | Sweden | 98.9 /100 | #74 | Exceptional 12.3% |
| Estonians | 98.9 /100 | #75 | Exceptional 12.3% |
| Greeks | 98.9 /100 | #76 | Exceptional 12.3% |
| Immigrants | Italy | 98.8 /100 | #77 | Exceptional 12.3% |
| Immigrants | Ukraine | 98.6 /100 | #78 | Exceptional 12.3% |
| Immigrants | Jordan | 98.5 /100 | #79 | Exceptional 12.4% |
| Immigrants | Malaysia | 98.3 /100 | #80 | Exceptional 12.4% |
| Immigrants | Kazakhstan | 98.1 /100 | #81 | Exceptional 12.4% |
| Ethiopians | 98.0 /100 | #82 | Exceptional 12.4% |
| Albanians | 97.7 /100 | #83 | Exceptional 12.5% |
| Immigrants | Latvia | 97.7 /100 | #84 | Exceptional 12.5% |
| Immigrants | South Eastern Asia | 97.6 /100 | #85 | Exceptional 12.5% |