Greek vs Immigrants from Venezuela Child Poverty Under the Age of 16
COMPARE
Greek
Immigrants from Venezuela
Child Poverty Under the Age of 16
Child Poverty Under the Age of 16 Comparison
Greeks
Immigrants from Venezuela
13.8%
CHILD POVERTY UNDER THE AGE OF 16
99.3/ 100
METRIC RATING
44th/ 347
METRIC RANK
15.7%
CHILD POVERTY UNDER THE AGE OF 16
74.9/ 100
METRIC RATING
156th/ 347
METRIC RANK
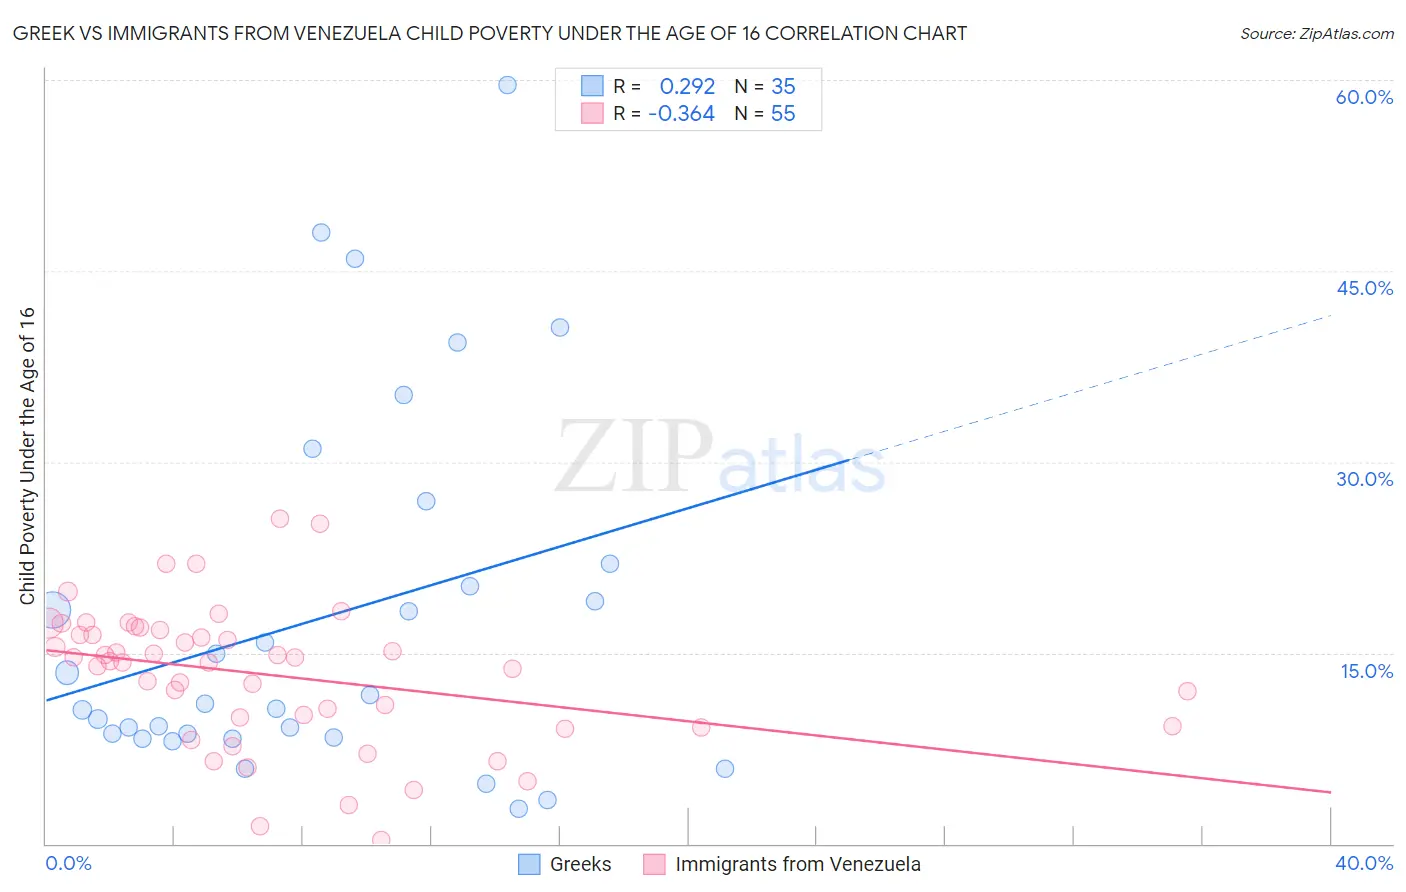
Greek vs Immigrants from Venezuela Child Poverty Under the Age of 16 Correlation Chart
The statistical analysis conducted on geographies consisting of 475,284,984 people shows a weak positive correlation between the proportion of Greeks and poverty level among children under the age of 16 in the United States with a correlation coefficient (R) of 0.292 and weighted average of 13.8%. Similarly, the statistical analysis conducted on geographies consisting of 286,470,184 people shows a mild negative correlation between the proportion of Immigrants from Venezuela and poverty level among children under the age of 16 in the United States with a correlation coefficient (R) of -0.364 and weighted average of 15.7%, a difference of 13.6%.
Child Poverty Under the Age of 16 Correlation Summary
| Measurement | Greek | Immigrants from Venezuela |
| Minimum | 2.8% | 0.32% |
| Maximum | 59.6% | 25.5% |
| Range | 56.9% | 25.2% |
| Mean | 17.8% | 13.2% |
| Median | 11.0% | 14.3% |
| Interquartile 25% (IQ1) | 8.3% | 9.2% |
| Interquartile 75% (IQ3) | 22.0% | 16.8% |
| Interquartile Range (IQR) | 13.6% | 7.5% |
| Standard Deviation (Sample) | 14.3% | 5.5% |
| Standard Deviation (Population) | 14.1% | 5.4% |
Similar Demographics by Child Poverty Under the Age of 16
Demographics Similar to Greeks by Child Poverty Under the Age of 16
In terms of child poverty under the age of 16, the demographic groups most similar to Greeks are Czech (13.8%, a difference of 0.050%), Immigrants from Moldova (13.8%, a difference of 0.17%), Immigrants from Sri Lanka (13.8%, a difference of 0.23%), Croatian (13.8%, a difference of 0.31%), and Immigrants from Asia (13.8%, a difference of 0.34%).
| Demographics | Rating | Rank | Child Poverty Under the Age of 16 |
| Immigrants | Bolivia | 99.6 /100 | #37 | Exceptional 13.6% |
| Luxembourgers | 99.5 /100 | #38 | Exceptional 13.6% |
| Immigrants | Australia | 99.5 /100 | #39 | Exceptional 13.6% |
| Immigrants | Scotland | 99.4 /100 | #40 | Exceptional 13.7% |
| Croatians | 99.4 /100 | #41 | Exceptional 13.8% |
| Immigrants | Sri Lanka | 99.3 /100 | #42 | Exceptional 13.8% |
| Immigrants | Moldova | 99.3 /100 | #43 | Exceptional 13.8% |
| Greeks | 99.3 /100 | #44 | Exceptional 13.8% |
| Czechs | 99.3 /100 | #45 | Exceptional 13.8% |
| Immigrants | Asia | 99.2 /100 | #46 | Exceptional 13.8% |
| Estonians | 99.2 /100 | #47 | Exceptional 13.9% |
| Koreans | 99.2 /100 | #48 | Exceptional 13.9% |
| Italians | 99.2 /100 | #49 | Exceptional 13.9% |
| Immigrants | Czechoslovakia | 99.1 /100 | #50 | Exceptional 13.9% |
| Immigrants | Greece | 99.1 /100 | #51 | Exceptional 13.9% |
Demographics Similar to Immigrants from Venezuela by Child Poverty Under the Age of 16
In terms of child poverty under the age of 16, the demographic groups most similar to Immigrants from Venezuela are Syrian (15.6%, a difference of 0.20%), Immigrants from Nepal (15.7%, a difference of 0.32%), Immigrants from Chile (15.7%, a difference of 0.33%), Samoan (15.6%, a difference of 0.41%), and Venezuelan (15.6%, a difference of 0.44%).
| Demographics | Rating | Rank | Child Poverty Under the Age of 16 |
| Israelis | 80.1 /100 | #149 | Excellent 15.5% |
| Immigrants | Jordan | 78.5 /100 | #150 | Good 15.6% |
| French | 78.5 /100 | #151 | Good 15.6% |
| French Canadians | 78.2 /100 | #152 | Good 15.6% |
| Venezuelans | 77.4 /100 | #153 | Good 15.6% |
| Samoans | 77.3 /100 | #154 | Good 15.6% |
| Syrians | 76.1 /100 | #155 | Good 15.6% |
| Immigrants | Venezuela | 74.9 /100 | #156 | Good 15.7% |
| Immigrants | Nepal | 72.9 /100 | #157 | Good 15.7% |
| Immigrants | Chile | 72.8 /100 | #158 | Good 15.7% |
| Immigrants | Fiji | 71.1 /100 | #159 | Good 15.8% |
| Immigrants | Albania | 70.7 /100 | #160 | Good 15.8% |
| Immigrants | Northern Africa | 68.1 /100 | #161 | Good 15.8% |
| Colombians | 67.6 /100 | #162 | Good 15.8% |
| Yugoslavians | 67.6 /100 | #163 | Good 15.8% |