German vs Immigrants from Morocco Female Poverty Among 25-34 Year Olds
COMPARE
German
Immigrants from Morocco
Female Poverty Among 25-34 Year Olds
Female Poverty Among 25-34 Year Olds Comparison
Germans
Immigrants from Morocco
13.6%
FEMALE POVERTY AMONG 25-34 YEAR OLDS
41.6/ 100
METRIC RATING
180th/ 347
METRIC RANK
12.8%
FEMALE POVERTY AMONG 25-34 YEAR OLDS
93.9/ 100
METRIC RATING
112th/ 347
METRIC RANK
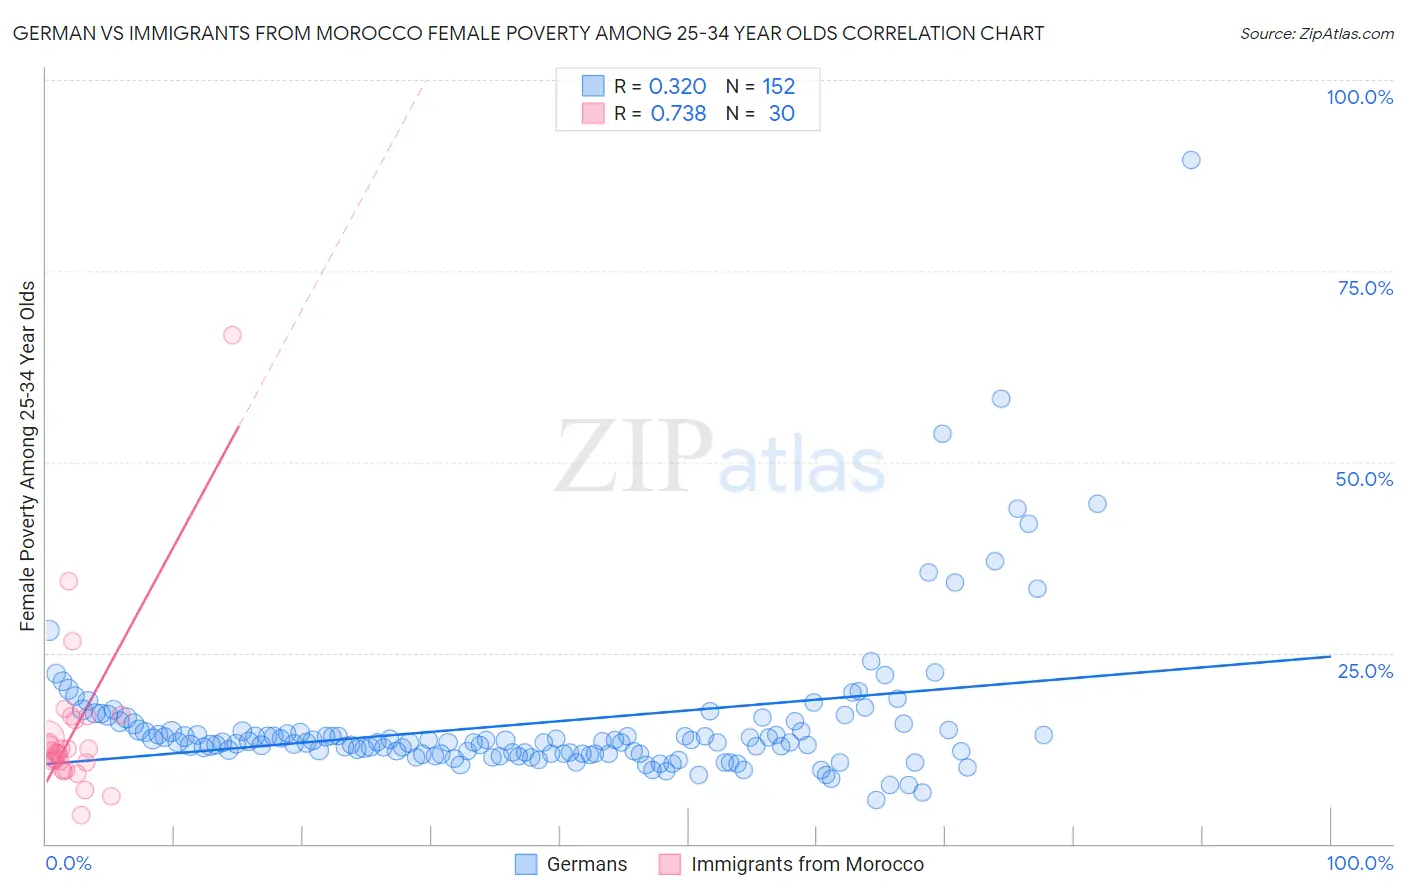
German vs Immigrants from Morocco Female Poverty Among 25-34 Year Olds Correlation Chart
The statistical analysis conducted on geographies consisting of 555,866,490 people shows a mild positive correlation between the proportion of Germans and poverty level among females between the ages 25 and 34 in the United States with a correlation coefficient (R) of 0.320 and weighted average of 13.6%. Similarly, the statistical analysis conducted on geographies consisting of 177,827,944 people shows a strong positive correlation between the proportion of Immigrants from Morocco and poverty level among females between the ages 25 and 34 in the United States with a correlation coefficient (R) of 0.738 and weighted average of 12.8%, a difference of 6.8%.
Female Poverty Among 25-34 Year Olds Correlation Summary
| Measurement | German | Immigrants from Morocco |
| Minimum | 5.7% | 3.8% |
| Maximum | 89.5% | 66.7% |
| Range | 83.7% | 62.9% |
| Mean | 15.8% | 14.9% |
| Median | 13.3% | 12.0% |
| Interquartile 25% (IQ1) | 11.8% | 10.6% |
| Interquartile 75% (IQ3) | 14.9% | 16.2% |
| Interquartile Range (IQR) | 3.1% | 5.6% |
| Standard Deviation (Sample) | 9.9% | 11.4% |
| Standard Deviation (Population) | 9.8% | 11.2% |
Similar Demographics by Female Poverty Among 25-34 Year Olds
Demographics Similar to Germans by Female Poverty Among 25-34 Year Olds
In terms of female poverty among 25-34 year olds, the demographic groups most similar to Germans are Guamanian/Chamorro (13.6%, a difference of 0.010%), Immigrants from Venezuela (13.6%, a difference of 0.070%), Portuguese (13.6%, a difference of 0.11%), Immigrants from Eastern Africa (13.6%, a difference of 0.17%), and Canadian (13.6%, a difference of 0.23%).
| Demographics | Rating | Rank | Female Poverty Among 25-34 Year Olds |
| Kenyans | 51.8 /100 | #173 | Average 13.5% |
| Immigrants | Oceania | 50.0 /100 | #174 | Average 13.5% |
| Bermudans | 46.8 /100 | #175 | Average 13.6% |
| Yugoslavians | 45.0 /100 | #176 | Average 13.6% |
| Venezuelans | 44.6 /100 | #177 | Average 13.6% |
| Canadians | 44.3 /100 | #178 | Average 13.6% |
| Immigrants | Eastern Africa | 43.6 /100 | #179 | Average 13.6% |
| Germans | 41.6 /100 | #180 | Average 13.6% |
| Guamanians/Chamorros | 41.5 /100 | #181 | Average 13.6% |
| Immigrants | Venezuela | 40.7 /100 | #182 | Average 13.6% |
| Portuguese | 40.3 /100 | #183 | Average 13.6% |
| Czechoslovakians | 36.8 /100 | #184 | Fair 13.7% |
| Irish | 35.3 /100 | #185 | Fair 13.7% |
| Immigrants | Uruguay | 34.1 /100 | #186 | Fair 13.7% |
| Slovaks | 34.1 /100 | #187 | Fair 13.7% |
Demographics Similar to Immigrants from Morocco by Female Poverty Among 25-34 Year Olds
In terms of female poverty among 25-34 year olds, the demographic groups most similar to Immigrants from Morocco are Danish (12.8%, a difference of 0.020%), Immigrants from Syria (12.8%, a difference of 0.040%), Australian (12.8%, a difference of 0.090%), Immigrants from Southern Europe (12.8%, a difference of 0.11%), and Immigrants from Peru (12.7%, a difference of 0.17%).
| Demographics | Rating | Rank | Female Poverty Among 25-34 Year Olds |
| Immigrants | South Africa | 95.3 /100 | #105 | Exceptional 12.7% |
| Tsimshian | 95.1 /100 | #106 | Exceptional 12.7% |
| Poles | 94.9 /100 | #107 | Exceptional 12.7% |
| Immigrants | Norway | 94.4 /100 | #108 | Exceptional 12.7% |
| Immigrants | Peru | 94.3 /100 | #109 | Exceptional 12.7% |
| Australians | 94.1 /100 | #110 | Exceptional 12.8% |
| Danes | 93.9 /100 | #111 | Exceptional 12.8% |
| Immigrants | Morocco | 93.9 /100 | #112 | Exceptional 12.8% |
| Immigrants | Syria | 93.8 /100 | #113 | Exceptional 12.8% |
| Immigrants | Southern Europe | 93.6 /100 | #114 | Exceptional 12.8% |
| Immigrants | Brazil | 93.3 /100 | #115 | Exceptional 12.8% |
| Chileans | 93.2 /100 | #116 | Exceptional 12.8% |
| Immigrants | Kuwait | 93.1 /100 | #117 | Exceptional 12.8% |
| Mongolians | 93.0 /100 | #118 | Exceptional 12.8% |
| Immigrants | Nepal | 93.0 /100 | #119 | Exceptional 12.8% |