French American Indian vs Immigrants from Caribbean Seniors Poverty Over the Age of 75
COMPARE
French American Indian
Immigrants from Caribbean
Seniors Poverty Over the Age of 75
Seniors Poverty Over the Age of 75 Comparison
French American Indians
Immigrants from Caribbean
12.9%
SENIORS POVERTY OVER THE AGE OF 75
6.1/ 100
METRIC RATING
213th/ 347
METRIC RANK
18.2%
SENIORS POVERTY OVER THE AGE OF 75
0.0/ 100
METRIC RATING
336th/ 347
METRIC RANK
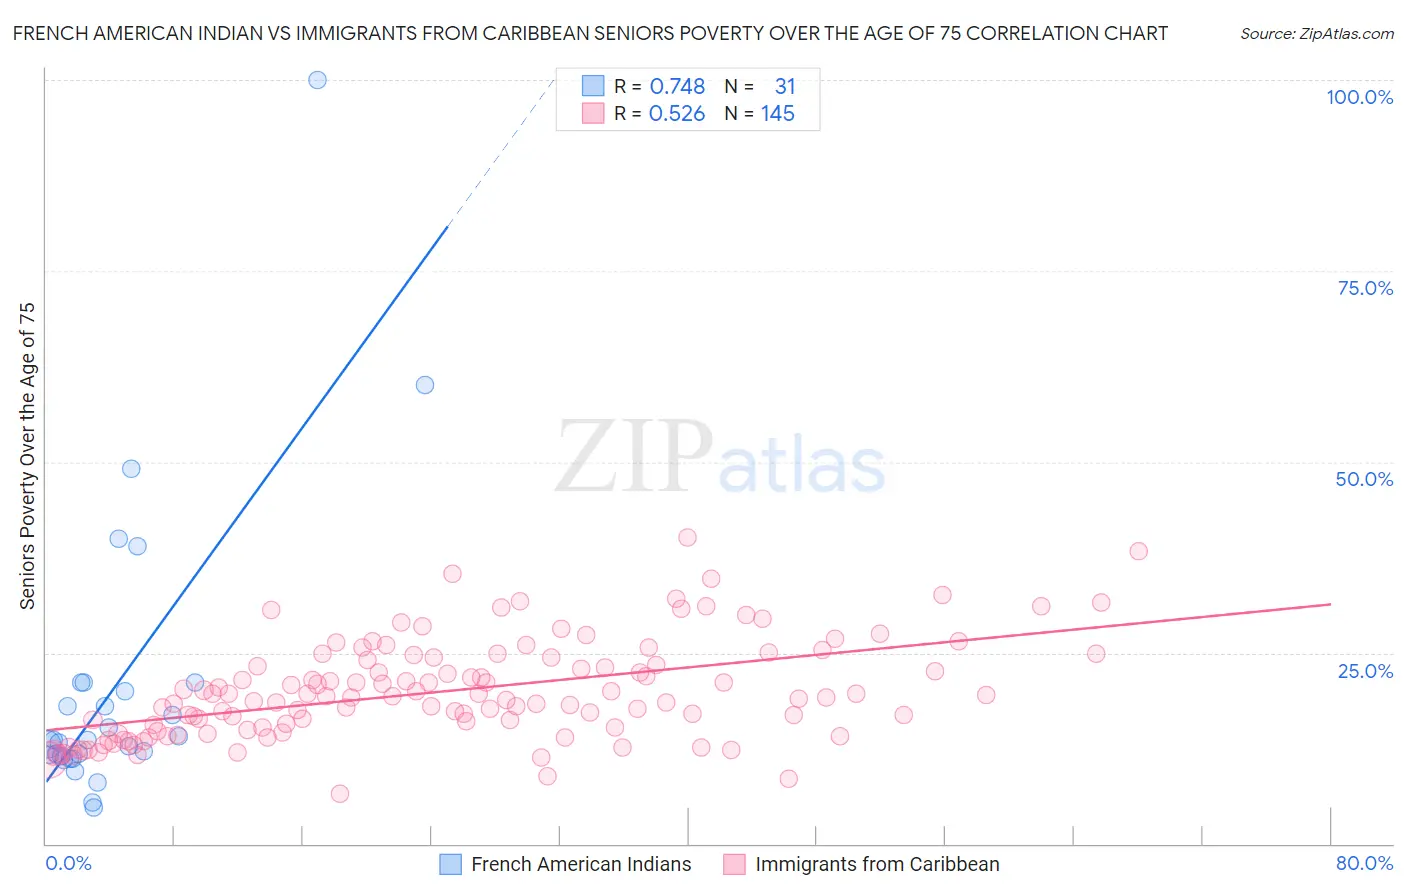
French American Indian vs Immigrants from Caribbean Seniors Poverty Over the Age of 75 Correlation Chart
The statistical analysis conducted on geographies consisting of 131,506,514 people shows a strong positive correlation between the proportion of French American Indians and poverty level among seniors over the age of 75 in the United States with a correlation coefficient (R) of 0.748 and weighted average of 12.9%. Similarly, the statistical analysis conducted on geographies consisting of 443,355,794 people shows a substantial positive correlation between the proportion of Immigrants from Caribbean and poverty level among seniors over the age of 75 in the United States with a correlation coefficient (R) of 0.526 and weighted average of 18.2%, a difference of 41.8%.
Seniors Poverty Over the Age of 75 Correlation Summary
| Measurement | French American Indian | Immigrants from Caribbean |
| Minimum | 4.8% | 6.6% |
| Maximum | 100.0% | 40.1% |
| Range | 95.2% | 33.5% |
| Mean | 20.6% | 19.9% |
| Median | 13.5% | 19.2% |
| Interquartile 25% (IQ1) | 11.5% | 14.8% |
| Interquartile 75% (IQ3) | 21.1% | 24.2% |
| Interquartile Range (IQR) | 9.5% | 9.4% |
| Standard Deviation (Sample) | 19.3% | 6.4% |
| Standard Deviation (Population) | 19.0% | 6.4% |
Similar Demographics by Seniors Poverty Over the Age of 75
Demographics Similar to French American Indians by Seniors Poverty Over the Age of 75
In terms of seniors poverty over the age of 75, the demographic groups most similar to French American Indians are Immigrants from Africa (12.9%, a difference of 0.070%), Immigrants from Hong Kong (12.8%, a difference of 0.15%), South American Indian (12.9%, a difference of 0.21%), Brazilian (12.8%, a difference of 0.28%), and Comanche (12.8%, a difference of 0.30%).
| Demographics | Rating | Rank | Seniors Poverty Over the Age of 75 |
| Albanians | 9.6 /100 | #206 | Tragic 12.7% |
| Costa Ricans | 8.7 /100 | #207 | Tragic 12.8% |
| Immigrants | Eastern Asia | 8.4 /100 | #208 | Tragic 12.8% |
| Immigrants | Liberia | 7.3 /100 | #209 | Tragic 12.8% |
| Comanche | 7.0 /100 | #210 | Tragic 12.8% |
| Brazilians | 6.9 /100 | #211 | Tragic 12.8% |
| Immigrants | Hong Kong | 6.5 /100 | #212 | Tragic 12.8% |
| French American Indians | 6.1 /100 | #213 | Tragic 12.9% |
| Immigrants | Africa | 5.9 /100 | #214 | Tragic 12.9% |
| South American Indians | 5.5 /100 | #215 | Tragic 12.9% |
| Immigrants | Brazil | 5.2 /100 | #216 | Tragic 12.9% |
| Bermudans | 4.9 /100 | #217 | Tragic 12.9% |
| Immigrants | Western Asia | 4.9 /100 | #218 | Tragic 12.9% |
| Ute | 4.7 /100 | #219 | Tragic 12.9% |
| Seminole | 4.5 /100 | #220 | Tragic 12.9% |
Demographics Similar to Immigrants from Caribbean by Seniors Poverty Over the Age of 75
In terms of seniors poverty over the age of 75, the demographic groups most similar to Immigrants from Caribbean are Yakama (18.3%, a difference of 0.40%), Immigrants from Cabo Verde (18.5%, a difference of 1.4%), Cuban (18.0%, a difference of 1.6%), Immigrants from Grenada (17.8%, a difference of 2.2%), and Hopi (18.9%, a difference of 3.4%).
| Demographics | Rating | Rank | Seniors Poverty Over the Age of 75 |
| Immigrants | Dominica | 0.0 /100 | #329 | Tragic 17.0% |
| British West Indians | 0.0 /100 | #330 | Tragic 17.4% |
| Immigrants | Armenia | 0.0 /100 | #331 | Tragic 17.5% |
| Immigrants | St. Vincent and the Grenadines | 0.0 /100 | #332 | Tragic 17.5% |
| Immigrants | Nicaragua | 0.0 /100 | #333 | Tragic 17.6% |
| Immigrants | Grenada | 0.0 /100 | #334 | Tragic 17.8% |
| Cubans | 0.0 /100 | #335 | Tragic 18.0% |
| Immigrants | Caribbean | 0.0 /100 | #336 | Tragic 18.2% |
| Yakama | 0.0 /100 | #337 | Tragic 18.3% |
| Immigrants | Cabo Verde | 0.0 /100 | #338 | Tragic 18.5% |
| Hopi | 0.0 /100 | #339 | Tragic 18.9% |
| Tohono O'odham | 0.0 /100 | #340 | Tragic 19.1% |
| Navajo | 0.0 /100 | #341 | Tragic 19.4% |
| Dominicans | 0.0 /100 | #342 | Tragic 19.6% |
| Lumbee | 0.0 /100 | #343 | Tragic 19.7% |