Finnish vs Immigrants from Romania Family Poverty
COMPARE
Finnish
Immigrants from Romania
Family Poverty
Family Poverty Comparison
Finns
Immigrants from Romania
7.7%
FAMILY POVERTY
98.7/ 100
METRIC RATING
58th/ 347
METRIC RANK
7.8%
FAMILY POVERTY
98.2/ 100
METRIC RATING
72nd/ 347
METRIC RANK
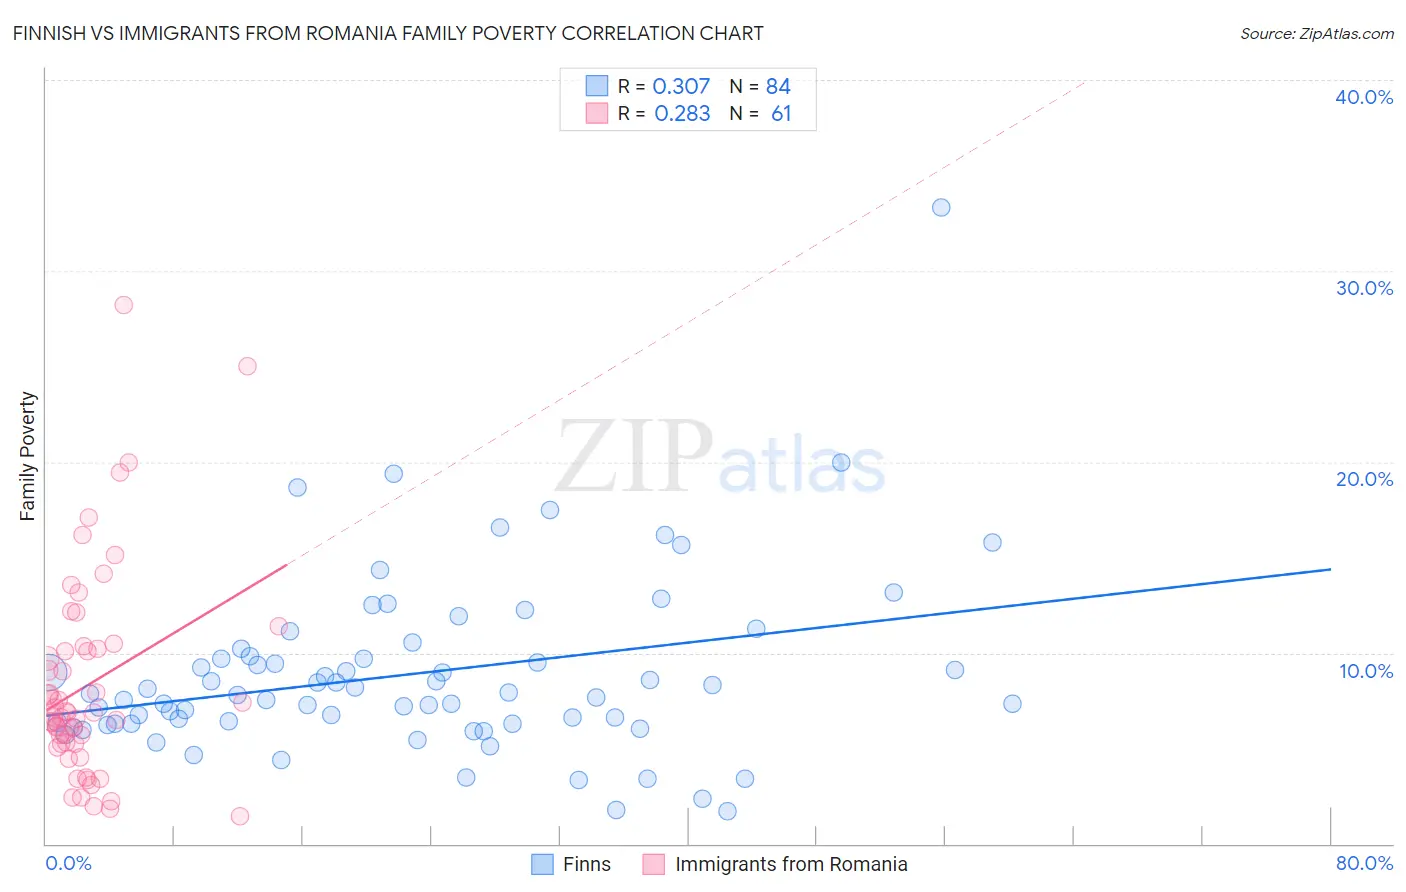
Finnish vs Immigrants from Romania Family Poverty Correlation Chart
The statistical analysis conducted on geographies consisting of 403,232,435 people shows a mild positive correlation between the proportion of Finns and poverty level among families in the United States with a correlation coefficient (R) of 0.307 and weighted average of 7.7%. Similarly, the statistical analysis conducted on geographies consisting of 256,635,029 people shows a weak positive correlation between the proportion of Immigrants from Romania and poverty level among families in the United States with a correlation coefficient (R) of 0.283 and weighted average of 7.8%, a difference of 1.3%.
Family Poverty Correlation Summary
| Measurement | Finnish | Immigrants from Romania |
| Minimum | 1.7% | 1.4% |
| Maximum | 33.3% | 28.2% |
| Range | 31.6% | 26.8% |
| Mean | 8.9% | 8.4% |
| Median | 7.8% | 6.9% |
| Interquartile 25% (IQ1) | 6.3% | 5.2% |
| Interquartile 75% (IQ3) | 9.8% | 10.3% |
| Interquartile Range (IQR) | 3.5% | 5.1% |
| Standard Deviation (Sample) | 4.7% | 5.4% |
| Standard Deviation (Population) | 4.7% | 5.4% |
Demographics Similar to Finns and Immigrants from Romania by Family Poverty
In terms of family poverty, the demographic groups most similar to Finns are European (7.7%, a difference of 0.010%), Immigrants from Greece (7.7%, a difference of 0.020%), Asian (7.7%, a difference of 0.030%), Immigrants from Serbia (7.7%, a difference of 0.12%), and Immigrants from Eastern Asia (7.7%, a difference of 0.16%). Similarly, the demographic groups most similar to Immigrants from Romania are Austrian (7.8%, a difference of 0.0%), Cambodian (7.8%, a difference of 0.060%), Immigrants from Canada (7.8%, a difference of 0.080%), Immigrants from China (7.8%, a difference of 0.080%), and Immigrants from Belgium (7.8%, a difference of 0.12%).
| Demographics | Rating | Rank | Family Poverty |
| Immigrants | Eastern Asia | 98.7 /100 | #55 | Exceptional 7.7% |
| Immigrants | Serbia | 98.7 /100 | #56 | Exceptional 7.7% |
| Asians | 98.7 /100 | #57 | Exceptional 7.7% |
| Finns | 98.7 /100 | #58 | Exceptional 7.7% |
| Europeans | 98.7 /100 | #59 | Exceptional 7.7% |
| Immigrants | Greece | 98.7 /100 | #60 | Exceptional 7.7% |
| Immigrants | Netherlands | 98.6 /100 | #61 | Exceptional 7.7% |
| Macedonians | 98.6 /100 | #62 | Exceptional 7.8% |
| Zimbabweans | 98.4 /100 | #63 | Exceptional 7.8% |
| Koreans | 98.3 /100 | #64 | Exceptional 7.8% |
| Immigrants | Bulgaria | 98.3 /100 | #65 | Exceptional 7.8% |
| Dutch | 98.3 /100 | #66 | Exceptional 7.8% |
| Northern Europeans | 98.3 /100 | #67 | Exceptional 7.8% |
| Australians | 98.2 /100 | #68 | Exceptional 7.8% |
| Immigrants | Belgium | 98.2 /100 | #69 | Exceptional 7.8% |
| Immigrants | Canada | 98.2 /100 | #70 | Exceptional 7.8% |
| Cambodians | 98.2 /100 | #71 | Exceptional 7.8% |
| Immigrants | Romania | 98.2 /100 | #72 | Exceptional 7.8% |
| Austrians | 98.2 /100 | #73 | Exceptional 7.8% |
| Immigrants | China | 98.1 /100 | #74 | Exceptional 7.8% |
| Immigrants | Croatia | 98.1 /100 | #75 | Exceptional 7.8% |