Filipino vs Immigrants from Ukraine Female Poverty Among 18-24 Year Olds
COMPARE
Filipino
Immigrants from Ukraine
Female Poverty Among 18-24 Year Olds
Female Poverty Among 18-24 Year Olds Comparison
Filipinos
Immigrants from Ukraine
19.0%
FEMALE POVERTY AMONG 18-24 YEAR OLDS
98.9/ 100
METRIC RATING
92nd/ 347
METRIC RANK
18.4%
FEMALE POVERTY AMONG 18-24 YEAR OLDS
99.9/ 100
METRIC RATING
58th/ 347
METRIC RANK
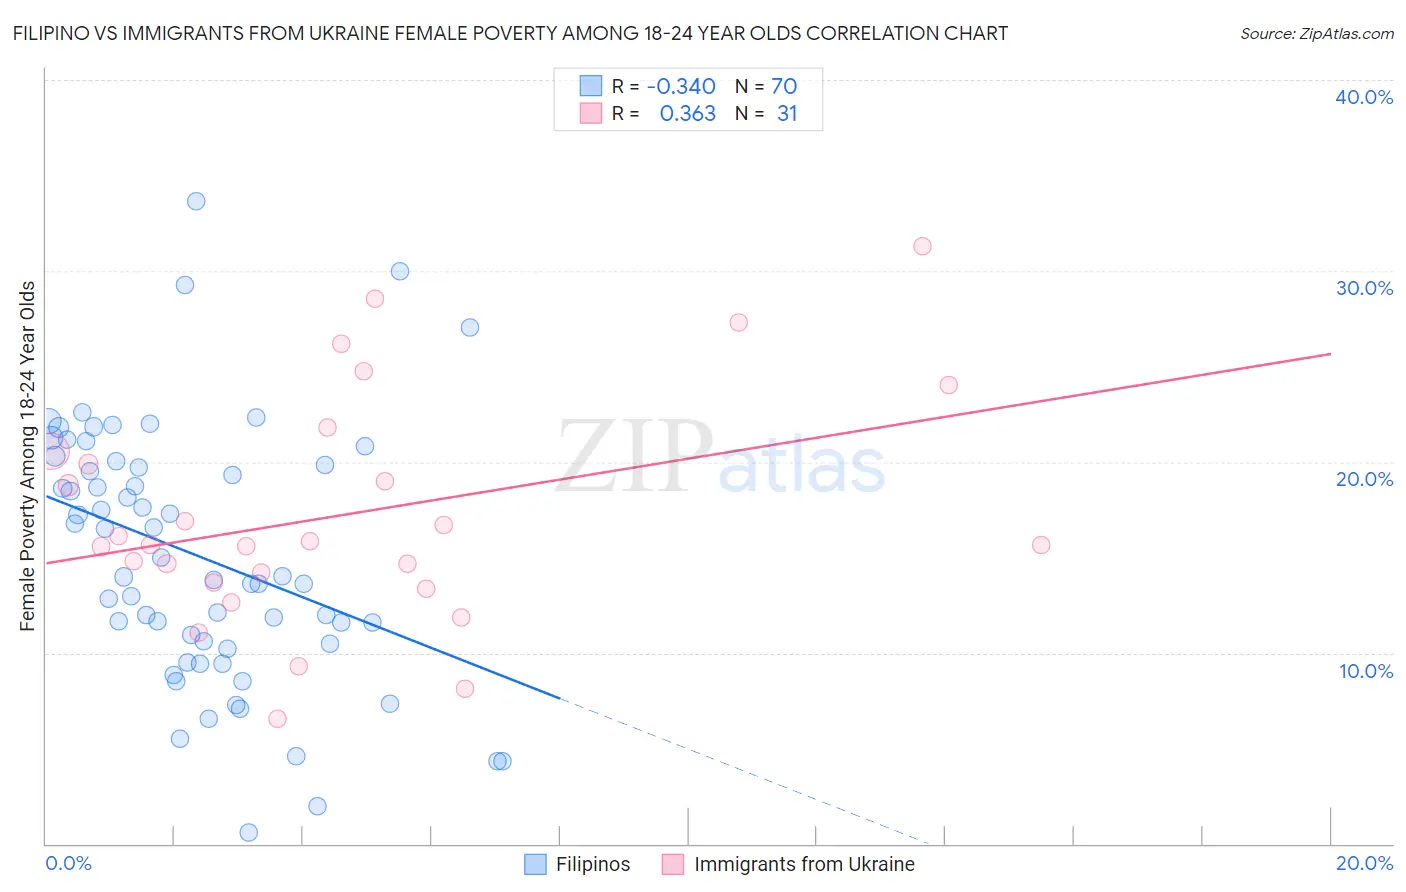
Filipino vs Immigrants from Ukraine Female Poverty Among 18-24 Year Olds Correlation Chart
The statistical analysis conducted on geographies consisting of 250,130,110 people shows a mild negative correlation between the proportion of Filipinos and poverty level among females between the ages 18 and 24 in the United States with a correlation coefficient (R) of -0.340 and weighted average of 19.0%. Similarly, the statistical analysis conducted on geographies consisting of 283,428,309 people shows a mild positive correlation between the proportion of Immigrants from Ukraine and poverty level among females between the ages 18 and 24 in the United States with a correlation coefficient (R) of 0.363 and weighted average of 18.4%, a difference of 3.2%.
Female Poverty Among 18-24 Year Olds Correlation Summary
| Measurement | Filipino | Immigrants from Ukraine |
| Minimum | 0.62% | 6.6% |
| Maximum | 33.7% | 31.3% |
| Range | 33.1% | 24.7% |
| Mean | 15.0% | 17.3% |
| Median | 14.0% | 15.7% |
| Interquartile 25% (IQ1) | 10.5% | 13.7% |
| Interquartile 75% (IQ3) | 19.9% | 20.6% |
| Interquartile Range (IQR) | 9.4% | 6.9% |
| Standard Deviation (Sample) | 6.7% | 6.0% |
| Standard Deviation (Population) | 6.7% | 5.9% |
Similar Demographics by Female Poverty Among 18-24 Year Olds
Demographics Similar to Filipinos by Female Poverty Among 18-24 Year Olds
In terms of female poverty among 18-24 year olds, the demographic groups most similar to Filipinos are Haitian (19.0%, a difference of 0.030%), Romanian (19.0%, a difference of 0.050%), Ukrainian (19.0%, a difference of 0.080%), Afghan (19.0%, a difference of 0.14%), and Guamanian/Chamorro (19.0%, a difference of 0.16%).
| Demographics | Rating | Rank | Female Poverty Among 18-24 Year Olds |
| Immigrants | Armenia | 99.2 /100 | #85 | Exceptional 18.9% |
| Immigrants | Iraq | 99.2 /100 | #86 | Exceptional 18.9% |
| Immigrants | Jamaica | 99.2 /100 | #87 | Exceptional 18.9% |
| Croatians | 99.1 /100 | #88 | Exceptional 19.0% |
| Immigrants | Cabo Verde | 99.0 /100 | #89 | Exceptional 19.0% |
| Afghans | 99.0 /100 | #90 | Exceptional 19.0% |
| Romanians | 98.9 /100 | #91 | Exceptional 19.0% |
| Filipinos | 98.9 /100 | #92 | Exceptional 19.0% |
| Haitians | 98.9 /100 | #93 | Exceptional 19.0% |
| Ukrainians | 98.8 /100 | #94 | Exceptional 19.0% |
| Guamanians/Chamorros | 98.8 /100 | #95 | Exceptional 19.0% |
| Sierra Leoneans | 98.7 /100 | #96 | Exceptional 19.0% |
| Salvadorans | 98.4 /100 | #97 | Exceptional 19.1% |
| Immigrants | Jordan | 98.4 /100 | #98 | Exceptional 19.1% |
| Immigrants | Czechoslovakia | 98.3 /100 | #99 | Exceptional 19.1% |
Demographics Similar to Immigrants from Ukraine by Female Poverty Among 18-24 Year Olds
In terms of female poverty among 18-24 year olds, the demographic groups most similar to Immigrants from Ukraine are Immigrants from Italy (18.4%, a difference of 0.060%), Argentinean (18.4%, a difference of 0.16%), Albanian (18.4%, a difference of 0.18%), Immigrants from Egypt (18.4%, a difference of 0.19%), and Egyptian (18.5%, a difference of 0.29%).
| Demographics | Rating | Rank | Female Poverty Among 18-24 Year Olds |
| Immigrants | Eastern Europe | 99.9 /100 | #51 | Exceptional 18.2% |
| Immigrants | Ireland | 99.9 /100 | #52 | Exceptional 18.3% |
| Italians | 99.9 /100 | #53 | Exceptional 18.3% |
| Immigrants | Egypt | 99.9 /100 | #54 | Exceptional 18.4% |
| Albanians | 99.9 /100 | #55 | Exceptional 18.4% |
| Argentineans | 99.9 /100 | #56 | Exceptional 18.4% |
| Immigrants | Italy | 99.9 /100 | #57 | Exceptional 18.4% |
| Immigrants | Ukraine | 99.9 /100 | #58 | Exceptional 18.4% |
| Egyptians | 99.9 /100 | #59 | Exceptional 18.5% |
| Immigrants | Brazil | 99.8 /100 | #60 | Exceptional 18.5% |
| Immigrants | Albania | 99.8 /100 | #61 | Exceptional 18.5% |
| Greeks | 99.8 /100 | #62 | Exceptional 18.5% |
| Immigrants | Belarus | 99.8 /100 | #63 | Exceptional 18.5% |
| Immigrants | Asia | 99.8 /100 | #64 | Exceptional 18.6% |
| Immigrants | Scotland | 99.8 /100 | #65 | Exceptional 18.6% |