Ethiopian vs Seminole Female Poverty Among 18-24 Year Olds
COMPARE
Ethiopian
Seminole
Female Poverty Among 18-24 Year Olds
Female Poverty Among 18-24 Year Olds Comparison
Ethiopians
Seminole
20.2%
FEMALE POVERTY AMONG 18-24 YEAR OLDS
43.8/ 100
METRIC RATING
179th/ 347
METRIC RANK
22.9%
FEMALE POVERTY AMONG 18-24 YEAR OLDS
0.0/ 100
METRIC RATING
301st/ 347
METRIC RANK
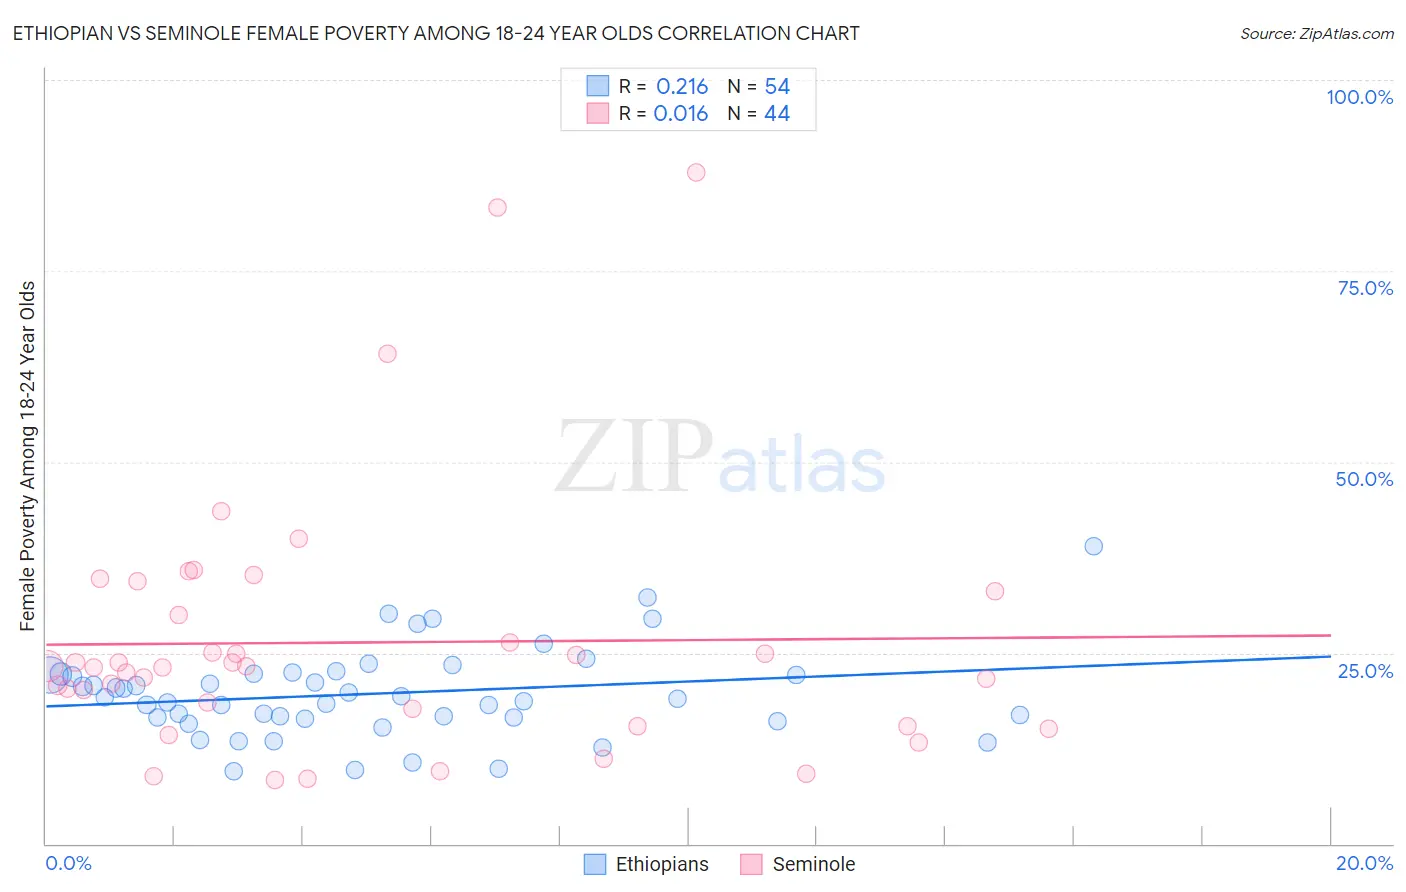
Ethiopian vs Seminole Female Poverty Among 18-24 Year Olds Correlation Chart
The statistical analysis conducted on geographies consisting of 221,304,111 people shows a weak positive correlation between the proportion of Ethiopians and poverty level among females between the ages 18 and 24 in the United States with a correlation coefficient (R) of 0.216 and weighted average of 20.2%. Similarly, the statistical analysis conducted on geographies consisting of 117,629,985 people shows no correlation between the proportion of Seminole and poverty level among females between the ages 18 and 24 in the United States with a correlation coefficient (R) of 0.016 and weighted average of 22.9%, a difference of 13.4%.
Female Poverty Among 18-24 Year Olds Correlation Summary
| Measurement | Ethiopian | Seminole |
| Minimum | 9.5% | 8.4% |
| Maximum | 39.0% | 87.8% |
| Range | 29.5% | 79.4% |
| Mean | 19.6% | 26.4% |
| Median | 19.0% | 23.2% |
| Interquartile 25% (IQ1) | 16.6% | 16.5% |
| Interquartile 75% (IQ3) | 22.3% | 31.6% |
| Interquartile Range (IQR) | 5.7% | 15.0% |
| Standard Deviation (Sample) | 5.8% | 16.9% |
| Standard Deviation (Population) | 5.7% | 16.7% |
Similar Demographics by Female Poverty Among 18-24 Year Olds
Demographics Similar to Ethiopians by Female Poverty Among 18-24 Year Olds
In terms of female poverty among 18-24 year olds, the demographic groups most similar to Ethiopians are Swiss (20.2%, a difference of 0.010%), Immigrants from Kazakhstan (20.2%, a difference of 0.020%), Iraqi (20.2%, a difference of 0.020%), Immigrants from China (20.2%, a difference of 0.040%), and Immigrants from Barbados (20.2%, a difference of 0.050%).
| Demographics | Rating | Rank | Female Poverty Among 18-24 Year Olds |
| Belizeans | 52.0 /100 | #172 | Average 20.1% |
| Irish | 50.0 /100 | #173 | Average 20.1% |
| Swedes | 50.0 /100 | #174 | Average 20.1% |
| South American Indians | 48.4 /100 | #175 | Average 20.1% |
| Kenyans | 44.9 /100 | #176 | Average 20.2% |
| Immigrants | Kazakhstan | 44.2 /100 | #177 | Average 20.2% |
| Swiss | 44.0 /100 | #178 | Average 20.2% |
| Ethiopians | 43.8 /100 | #179 | Average 20.2% |
| Iraqis | 43.3 /100 | #180 | Average 20.2% |
| Immigrants | China | 43.0 /100 | #181 | Average 20.2% |
| Immigrants | Barbados | 42.8 /100 | #182 | Average 20.2% |
| Lebanese | 40.6 /100 | #183 | Average 20.2% |
| Immigrants | Central America | 39.9 /100 | #184 | Fair 20.2% |
| Nepalese | 39.7 /100 | #185 | Fair 20.2% |
| Immigrants | Ethiopia | 37.3 /100 | #186 | Fair 20.2% |
Demographics Similar to Seminole by Female Poverty Among 18-24 Year Olds
In terms of female poverty among 18-24 year olds, the demographic groups most similar to Seminole are African (22.8%, a difference of 0.090%), Iroquois (22.9%, a difference of 0.39%), Senegalese (23.0%, a difference of 0.54%), Sudanese (23.0%, a difference of 0.69%), and Immigrants from Kuwait (23.0%, a difference of 0.74%).
| Demographics | Rating | Rank | Female Poverty Among 18-24 Year Olds |
| Indonesians | 0.0 /100 | #294 | Tragic 22.5% |
| Shoshone | 0.0 /100 | #295 | Tragic 22.5% |
| Menominee | 0.0 /100 | #296 | Tragic 22.5% |
| Inupiat | 0.0 /100 | #297 | Tragic 22.6% |
| Central American Indians | 0.0 /100 | #298 | Tragic 22.6% |
| Cherokee | 0.0 /100 | #299 | Tragic 22.7% |
| Africans | 0.0 /100 | #300 | Tragic 22.8% |
| Seminole | 0.0 /100 | #301 | Tragic 22.9% |
| Iroquois | 0.0 /100 | #302 | Tragic 22.9% |
| Senegalese | 0.0 /100 | #303 | Tragic 23.0% |
| Sudanese | 0.0 /100 | #304 | Tragic 23.0% |
| Immigrants | Kuwait | 0.0 /100 | #305 | Tragic 23.0% |
| Paiute | 0.0 /100 | #306 | Tragic 23.3% |
| Cree | 0.0 /100 | #307 | Tragic 23.4% |
| Immigrants | Sudan | 0.0 /100 | #308 | Tragic 23.5% |