English vs Guamanian/Chamorro Female Poverty Among 18-24 Year Olds
COMPARE
English
Guamanian/Chamorro
Female Poverty Among 18-24 Year Olds
Female Poverty Among 18-24 Year Olds Comparison
English
Guamanians/Chamorros
20.5%
FEMALE POVERTY AMONG 18-24 YEAR OLDS
16.7/ 100
METRIC RATING
205th/ 347
METRIC RANK
19.0%
FEMALE POVERTY AMONG 18-24 YEAR OLDS
98.8/ 100
METRIC RATING
95th/ 347
METRIC RANK
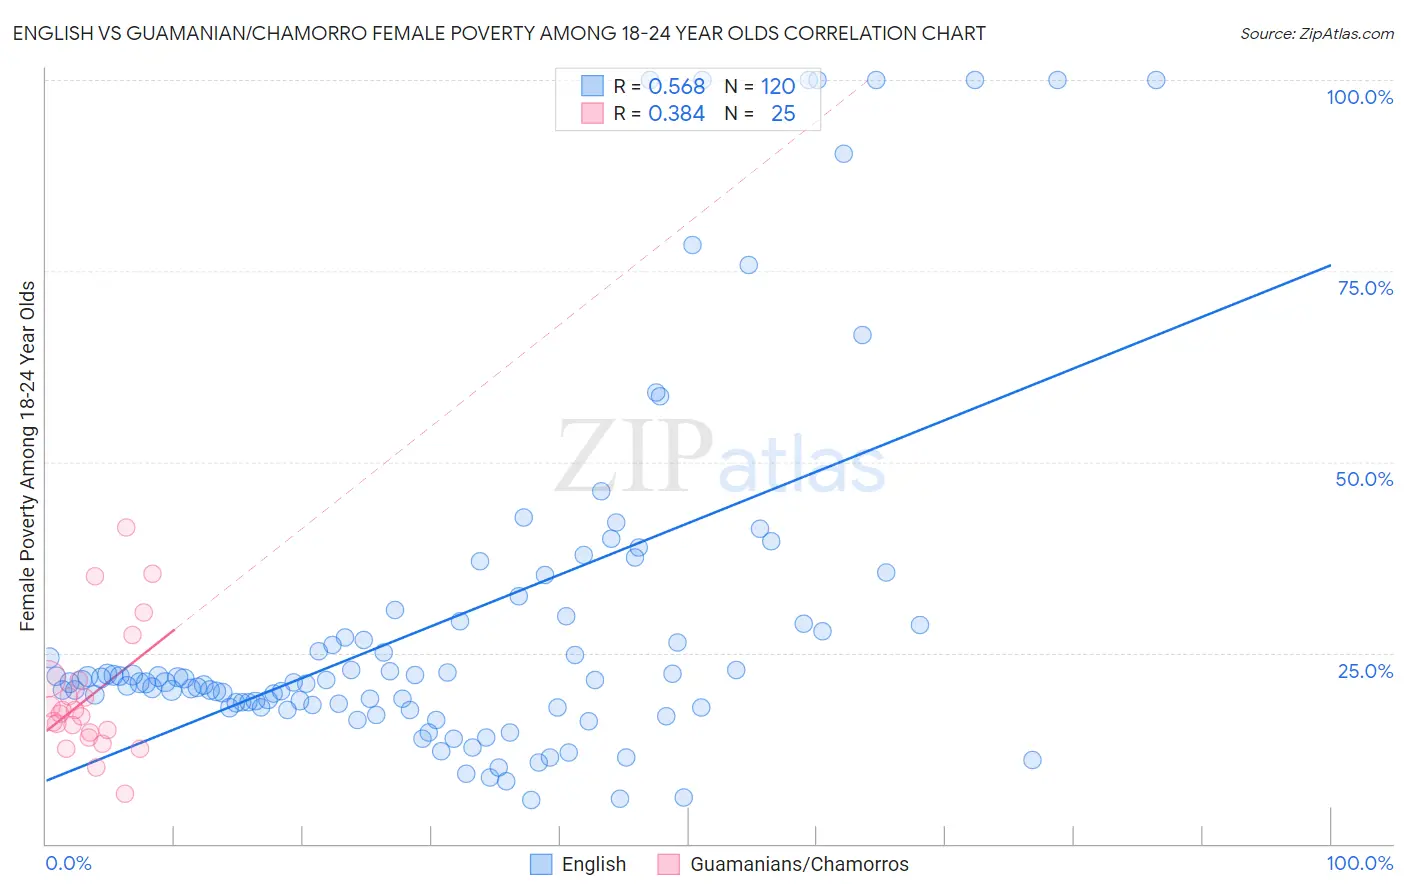
English vs Guamanian/Chamorro Female Poverty Among 18-24 Year Olds Correlation Chart
The statistical analysis conducted on geographies consisting of 541,696,358 people shows a substantial positive correlation between the proportion of English and poverty level among females between the ages 18 and 24 in the United States with a correlation coefficient (R) of 0.568 and weighted average of 20.5%. Similarly, the statistical analysis conducted on geographies consisting of 219,657,100 people shows a mild positive correlation between the proportion of Guamanians/Chamorros and poverty level among females between the ages 18 and 24 in the United States with a correlation coefficient (R) of 0.384 and weighted average of 19.0%, a difference of 7.7%.
Female Poverty Among 18-24 Year Olds Correlation Summary
| Measurement | English | Guamanian/Chamorro |
| Minimum | 5.7% | 6.5% |
| Maximum | 100.0% | 41.5% |
| Range | 94.3% | 34.9% |
| Mean | 29.3% | 19.3% |
| Median | 21.3% | 17.0% |
| Interquartile 25% (IQ1) | 18.0% | 14.3% |
| Interquartile 75% (IQ3) | 28.9% | 21.5% |
| Interquartile Range (IQR) | 10.9% | 7.2% |
| Standard Deviation (Sample) | 23.4% | 8.4% |
| Standard Deviation (Population) | 23.3% | 8.3% |
Similar Demographics by Female Poverty Among 18-24 Year Olds
Demographics Similar to English by Female Poverty Among 18-24 Year Olds
In terms of female poverty among 18-24 year olds, the demographic groups most similar to English are Hispanic or Latino (20.5%, a difference of 0.010%), Immigrants from Netherlands (20.5%, a difference of 0.020%), Spaniard (20.5%, a difference of 0.030%), Immigrants from Malaysia (20.5%, a difference of 0.040%), and Dutch (20.5%, a difference of 0.070%).
| Demographics | Rating | Rank | Female Poverty Among 18-24 Year Olds |
| Immigrants | Spain | 20.7 /100 | #198 | Fair 20.4% |
| Germans | 20.6 /100 | #199 | Fair 20.4% |
| Europeans | 19.9 /100 | #200 | Poor 20.4% |
| Mexicans | 18.3 /100 | #201 | Poor 20.5% |
| Immigrants | Turkey | 17.7 /100 | #202 | Poor 20.5% |
| Immigrants | Malaysia | 17.2 /100 | #203 | Poor 20.5% |
| Immigrants | Netherlands | 17.0 /100 | #204 | Poor 20.5% |
| English | 16.7 /100 | #205 | Poor 20.5% |
| Hispanics or Latinos | 16.6 /100 | #206 | Poor 20.5% |
| Spaniards | 16.3 /100 | #207 | Poor 20.5% |
| Dutch | 15.9 /100 | #208 | Poor 20.5% |
| Arabs | 15.5 /100 | #209 | Poor 20.5% |
| Immigrants | Ghana | 14.3 /100 | #210 | Poor 20.5% |
| Immigrants | Western Europe | 13.5 /100 | #211 | Poor 20.6% |
| Liberians | 11.6 /100 | #212 | Poor 20.6% |
Demographics Similar to Guamanians/Chamorros by Female Poverty Among 18-24 Year Olds
In terms of female poverty among 18-24 year olds, the demographic groups most similar to Guamanians/Chamorros are Ukrainian (19.0%, a difference of 0.070%), Sierra Leonean (19.0%, a difference of 0.10%), Haitian (19.0%, a difference of 0.13%), Filipino (19.0%, a difference of 0.16%), and Romanian (19.0%, a difference of 0.20%).
| Demographics | Rating | Rank | Female Poverty Among 18-24 Year Olds |
| Croatians | 99.1 /100 | #88 | Exceptional 19.0% |
| Immigrants | Cabo Verde | 99.0 /100 | #89 | Exceptional 19.0% |
| Afghans | 99.0 /100 | #90 | Exceptional 19.0% |
| Romanians | 98.9 /100 | #91 | Exceptional 19.0% |
| Filipinos | 98.9 /100 | #92 | Exceptional 19.0% |
| Haitians | 98.9 /100 | #93 | Exceptional 19.0% |
| Ukrainians | 98.8 /100 | #94 | Exceptional 19.0% |
| Guamanians/Chamorros | 98.8 /100 | #95 | Exceptional 19.0% |
| Sierra Leoneans | 98.7 /100 | #96 | Exceptional 19.0% |
| Salvadorans | 98.4 /100 | #97 | Exceptional 19.1% |
| Immigrants | Jordan | 98.4 /100 | #98 | Exceptional 19.1% |
| Immigrants | Czechoslovakia | 98.3 /100 | #99 | Exceptional 19.1% |
| Chileans | 98.3 /100 | #100 | Exceptional 19.1% |
| Ecuadorians | 98.1 /100 | #101 | Exceptional 19.1% |
| Immigrants | Caribbean | 98.1 /100 | #102 | Exceptional 19.1% |