Ecuadorian vs Welsh Female Poverty Among 25-34 Year Olds
COMPARE
Ecuadorian
Welsh
Female Poverty Among 25-34 Year Olds
Female Poverty Among 25-34 Year Olds Comparison
Ecuadorians
Welsh
14.3%
FEMALE POVERTY AMONG 25-34 YEAR OLDS
5.2/ 100
METRIC RATING
219th/ 347
METRIC RANK
14.0%
FEMALE POVERTY AMONG 25-34 YEAR OLDS
17.2/ 100
METRIC RATING
202nd/ 347
METRIC RANK
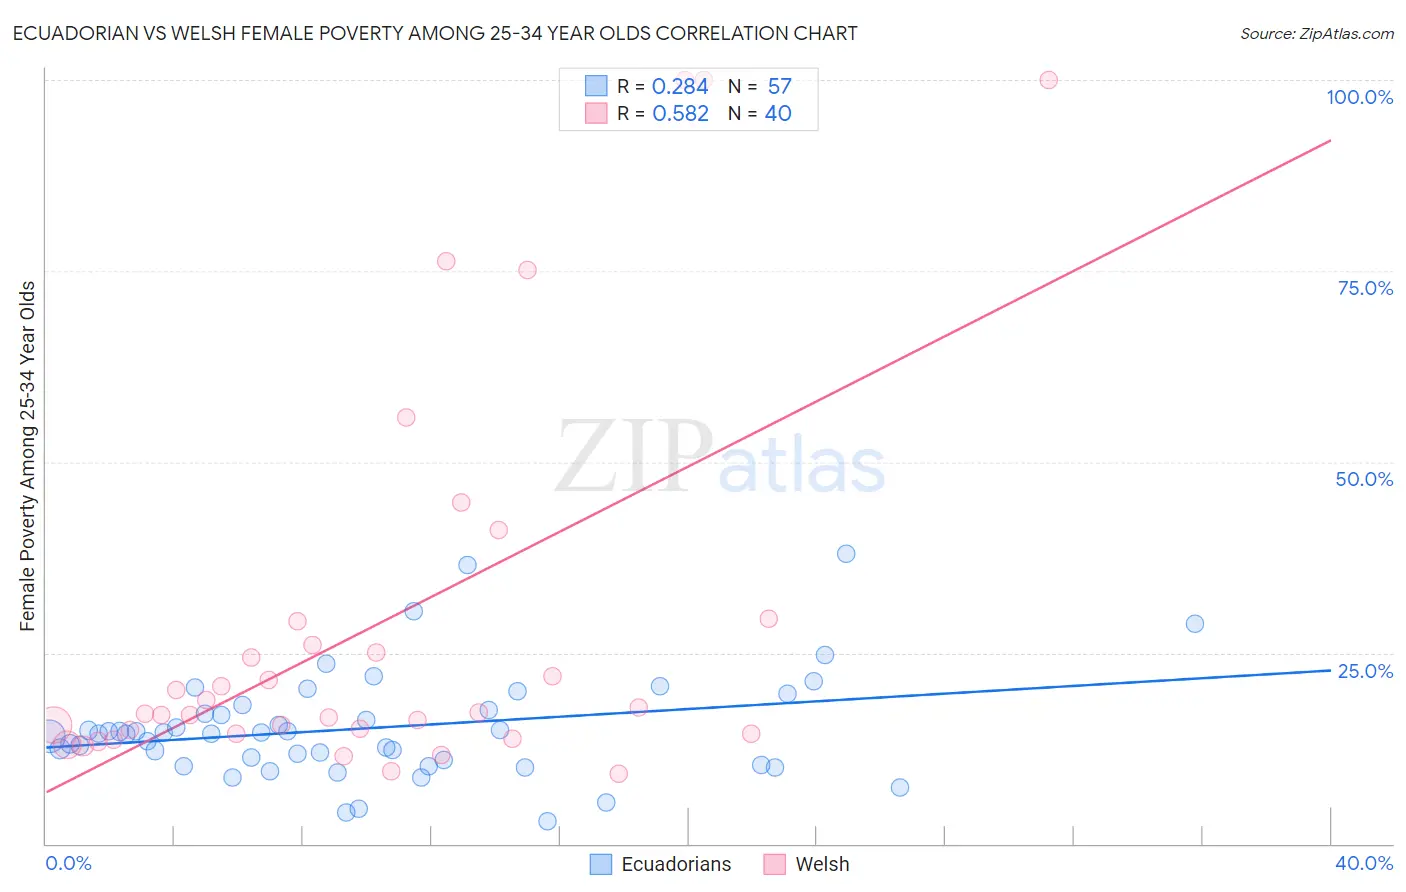
Ecuadorian vs Welsh Female Poverty Among 25-34 Year Olds Correlation Chart
The statistical analysis conducted on geographies consisting of 313,777,043 people shows a weak positive correlation between the proportion of Ecuadorians and poverty level among females between the ages 25 and 34 in the United States with a correlation coefficient (R) of 0.284 and weighted average of 14.3%. Similarly, the statistical analysis conducted on geographies consisting of 511,618,388 people shows a substantial positive correlation between the proportion of Welsh and poverty level among females between the ages 25 and 34 in the United States with a correlation coefficient (R) of 0.582 and weighted average of 14.0%, a difference of 2.7%.
Female Poverty Among 25-34 Year Olds Correlation Summary
| Measurement | Ecuadorian | Welsh |
| Minimum | 2.9% | 9.1% |
| Maximum | 38.0% | 100.0% |
| Range | 35.1% | 90.9% |
| Mean | 15.1% | 28.7% |
| Median | 14.5% | 17.1% |
| Interquartile 25% (IQ1) | 10.6% | 14.4% |
| Interquartile 75% (IQ3) | 17.8% | 27.5% |
| Interquartile Range (IQR) | 7.2% | 13.1% |
| Standard Deviation (Sample) | 7.0% | 25.7% |
| Standard Deviation (Population) | 6.9% | 25.4% |
Demographics Similar to Ecuadorians and Welsh by Female Poverty Among 25-34 Year Olds
In terms of female poverty among 25-34 year olds, the demographic groups most similar to Ecuadorians are Immigrants from Thailand (14.3%, a difference of 0.0%), Spanish American Indian (14.3%, a difference of 0.11%), French Canadian (14.3%, a difference of 0.12%), Ghanaian (14.4%, a difference of 0.16%), and Immigrants from Nigeria (14.3%, a difference of 0.37%). Similarly, the demographic groups most similar to Welsh are Immigrants from Trinidad and Tobago (14.0%, a difference of 0.050%), Hmong (13.9%, a difference of 0.41%), Immigrants (14.0%, a difference of 0.41%), Hawaiian (14.1%, a difference of 0.56%), and Immigrants from Africa (14.1%, a difference of 0.60%).
| Demographics | Rating | Rank | Female Poverty Among 25-34 Year Olds |
| Hmong | 20.3 /100 | #200 | Fair 13.9% |
| Immigrants | Trinidad and Tobago | 17.6 /100 | #201 | Poor 14.0% |
| Welsh | 17.2 /100 | #202 | Poor 14.0% |
| Immigrants | Immigrants | 14.5 /100 | #203 | Poor 14.0% |
| Hawaiians | 13.6 /100 | #204 | Poor 14.1% |
| Immigrants | Africa | 13.4 /100 | #205 | Poor 14.1% |
| Hungarians | 11.8 /100 | #206 | Poor 14.1% |
| Japanese | 11.7 /100 | #207 | Poor 14.1% |
| Immigrants | Panama | 11.6 /100 | #208 | Poor 14.1% |
| Guyanese | 8.6 /100 | #209 | Tragic 14.2% |
| Panamanians | 8.6 /100 | #210 | Tragic 14.2% |
| Trinidadians and Tobagonians | 8.2 /100 | #211 | Tragic 14.2% |
| Immigrants | Guyana | 6.6 /100 | #212 | Tragic 14.3% |
| Puget Sound Salish | 6.5 /100 | #213 | Tragic 14.3% |
| French | 6.2 /100 | #214 | Tragic 14.3% |
| Immigrants | Nigeria | 6.2 /100 | #215 | Tragic 14.3% |
| French Canadians | 5.5 /100 | #216 | Tragic 14.3% |
| Spanish American Indians | 5.5 /100 | #217 | Tragic 14.3% |
| Immigrants | Thailand | 5.2 /100 | #218 | Tragic 14.3% |
| Ecuadorians | 5.2 /100 | #219 | Tragic 14.3% |
| Ghanaians | 4.8 /100 | #220 | Tragic 14.4% |