Dutch West Indian vs Immigrants from Germany Seniors Poverty Over the Age of 75
COMPARE
Dutch West Indian
Immigrants from Germany
Seniors Poverty Over the Age of 75
Seniors Poverty Over the Age of 75 Comparison
Dutch West Indians
Immigrants from Germany
13.5%
SENIORS POVERTY OVER THE AGE OF 75
0.6/ 100
METRIC RATING
243rd/ 347
METRIC RANK
11.5%
SENIORS POVERTY OVER THE AGE OF 75
94.1/ 100
METRIC RATING
91st/ 347
METRIC RANK
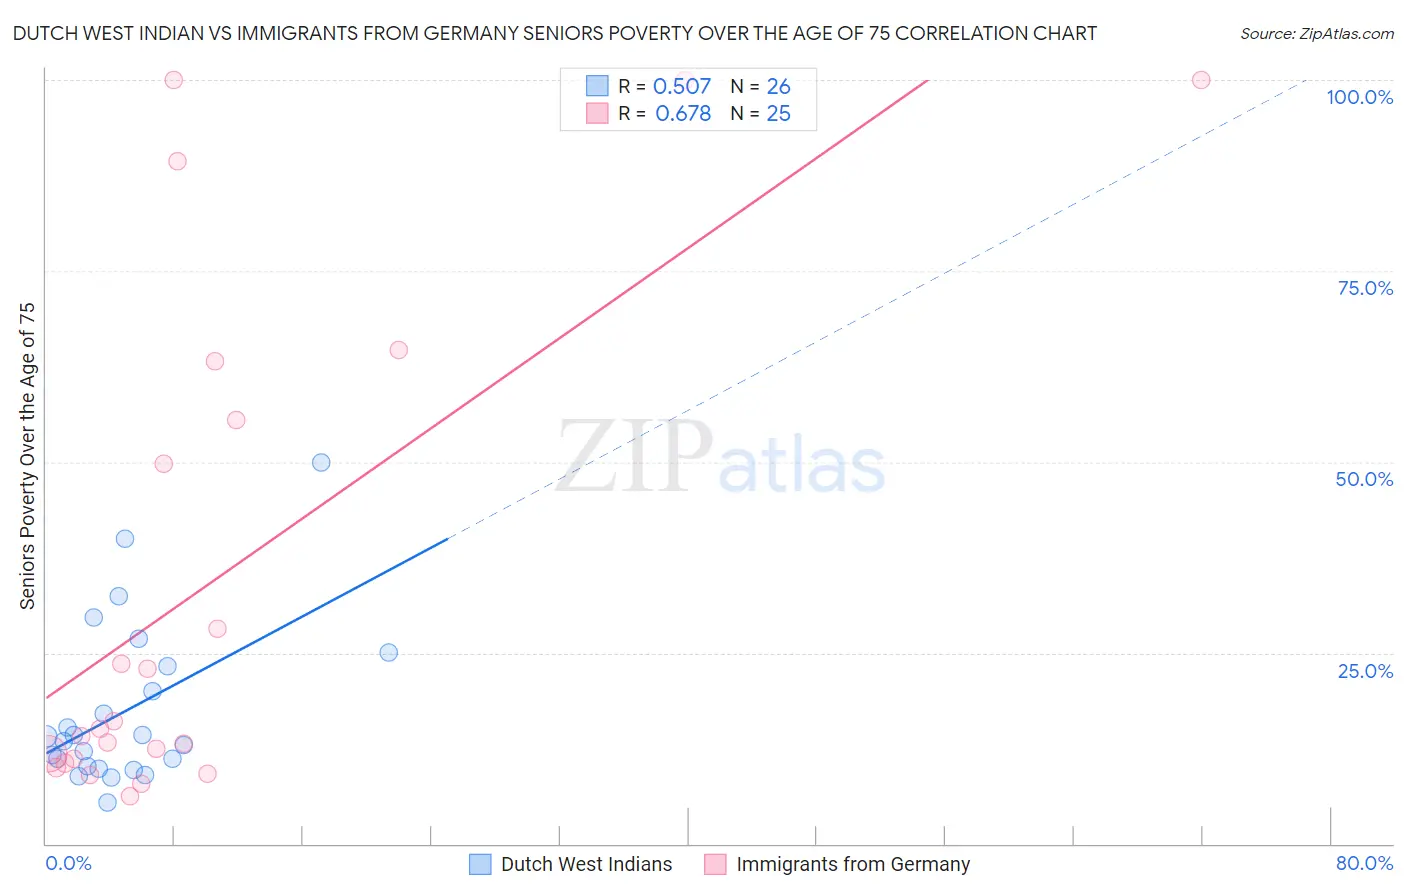
Dutch West Indian vs Immigrants from Germany Seniors Poverty Over the Age of 75 Correlation Chart
The statistical analysis conducted on geographies consisting of 85,427,649 people shows a substantial positive correlation between the proportion of Dutch West Indians and poverty level among seniors over the age of 75 in the United States with a correlation coefficient (R) of 0.507 and weighted average of 13.5%. Similarly, the statistical analysis conducted on geographies consisting of 457,232,902 people shows a significant positive correlation between the proportion of Immigrants from Germany and poverty level among seniors over the age of 75 in the United States with a correlation coefficient (R) of 0.678 and weighted average of 11.5%, a difference of 17.0%.
Seniors Poverty Over the Age of 75 Correlation Summary
| Measurement | Dutch West Indian | Immigrants from Germany |
| Minimum | 5.4% | 6.2% |
| Maximum | 50.0% | 100.0% |
| Range | 44.6% | 93.8% |
| Mean | 17.5% | 34.3% |
| Median | 13.8% | 15.1% |
| Interquartile 25% (IQ1) | 10.2% | 10.8% |
| Interquartile 75% (IQ3) | 23.2% | 59.4% |
| Interquartile Range (IQR) | 13.0% | 48.6% |
| Standard Deviation (Sample) | 10.7% | 33.0% |
| Standard Deviation (Population) | 10.5% | 32.3% |
Similar Demographics by Seniors Poverty Over the Age of 75
Demographics Similar to Dutch West Indians by Seniors Poverty Over the Age of 75
In terms of seniors poverty over the age of 75, the demographic groups most similar to Dutch West Indians are Immigrants from Somalia (13.5%, a difference of 0.030%), Immigrants from Russia (13.4%, a difference of 0.12%), Argentinean (13.4%, a difference of 0.26%), Spanish American (13.5%, a difference of 0.32%), and Uruguayan (13.5%, a difference of 0.46%).
| Demographics | Rating | Rank | Seniors Poverty Over the Age of 75 |
| Moroccans | 0.9 /100 | #236 | Tragic 13.3% |
| Alaskan Athabascans | 0.8 /100 | #237 | Tragic 13.4% |
| Peruvians | 0.8 /100 | #238 | Tragic 13.4% |
| Panamanians | 0.8 /100 | #239 | Tragic 13.4% |
| Argentineans | 0.7 /100 | #240 | Tragic 13.4% |
| Immigrants | Russia | 0.6 /100 | #241 | Tragic 13.4% |
| Immigrants | Somalia | 0.6 /100 | #242 | Tragic 13.5% |
| Dutch West Indians | 0.6 /100 | #243 | Tragic 13.5% |
| Spanish Americans | 0.5 /100 | #244 | Tragic 13.5% |
| Uruguayans | 0.5 /100 | #245 | Tragic 13.5% |
| Immigrants | Cambodia | 0.4 /100 | #246 | Tragic 13.6% |
| Immigrants | Ukraine | 0.3 /100 | #247 | Tragic 13.6% |
| Africans | 0.3 /100 | #248 | Tragic 13.6% |
| Immigrants | Albania | 0.3 /100 | #249 | Tragic 13.6% |
| Mexican American Indians | 0.3 /100 | #250 | Tragic 13.6% |
Demographics Similar to Immigrants from Germany by Seniors Poverty Over the Age of 75
In terms of seniors poverty over the age of 75, the demographic groups most similar to Immigrants from Germany are Aleut (11.5%, a difference of 0.020%), Kenyan (11.5%, a difference of 0.070%), Immigrants from Sri Lanka (11.5%, a difference of 0.13%), Immigrants from Croatia (11.5%, a difference of 0.16%), and Korean (11.5%, a difference of 0.18%).
| Demographics | Rating | Rank | Seniors Poverty Over the Age of 75 |
| Immigrants | Iraq | 94.9 /100 | #84 | Exceptional 11.5% |
| Immigrants | Bulgaria | 94.7 /100 | #85 | Exceptional 11.5% |
| Australians | 94.6 /100 | #86 | Exceptional 11.5% |
| Koreans | 94.5 /100 | #87 | Exceptional 11.5% |
| Immigrants | Croatia | 94.5 /100 | #88 | Exceptional 11.5% |
| Immigrants | Sri Lanka | 94.4 /100 | #89 | Exceptional 11.5% |
| Aleuts | 94.1 /100 | #90 | Exceptional 11.5% |
| Immigrants | Germany | 94.1 /100 | #91 | Exceptional 11.5% |
| Kenyans | 93.9 /100 | #92 | Exceptional 11.5% |
| Immigrants | Poland | 92.9 /100 | #93 | Exceptional 11.6% |
| Creek | 92.7 /100 | #94 | Exceptional 11.6% |
| Immigrants | Bosnia and Herzegovina | 92.6 /100 | #95 | Exceptional 11.6% |
| Immigrants | Sweden | 92.6 /100 | #96 | Exceptional 11.6% |
| Romanians | 92.3 /100 | #97 | Exceptional 11.6% |
| Immigrants | Japan | 91.9 /100 | #98 | Exceptional 11.6% |